
By Sophie Owens, Undergraduate Research Assistant, Iowa State University and Samuel C.H. Mindes, Assistant Professor, Iowa State University
I. Introduction
Access to adequate and sustainable food is a foundational component of household well-being. Yet for many households, this access remains uncertain. Food insecurity represents a measurable condition shaped by both economic and social factors, reflecting varying degrees of stability in a household’s ability to consistently obtain sufficient food. Examining how food insecurity exists across the population and the factors associated with it is essential for understanding broader patterns of household vulnerability.
This analysis uses data from the North Central Regional Center for Rural Development’s NCR-Stat: Housing and Food Security Survey (Mindes et al., 2026) to examine food insecurity across the North Central Region. This snapshot first defines food insecurity and explains how it is observed and measured. It then analyzes how food insecurity varies by household income, identifying patterns in its distribution. Finally, it examines participation in the Supplemental Nutrition Assistance Program (SNAP) and food stamps programs within income groups to better understand how food insecurity is experienced across different household conditions.
II. What is Food Insecurity?
The United States Department of Agriculture defines food insecurity as “a household-level economic and social condition of limited or uncertain access to adequate food” (Economic Research Service, 2026). This definition situates food insecurity not simply as a matter of hunger, but as an observable socio-economic condition shaped by instability, constraint, and uncertainty in everyday life. For example, a household that maintains access to food but regularly worries about running out or compromises on food quality may be categorized as marginally food secure. In contrast, a household that reduces meal size, skips meals, or goes entire days without eating due to financial limitations may be classified as experiencing very low food security.
In the NCR-Stat survey, food security status was measured using the USDA’s Adult Food Security Survey Module, which includes items on food access, meal reduction, and experiences of hunger. Responses were coded following USDA scoring conventions to classify households into high, marginal, low, and very low food security.
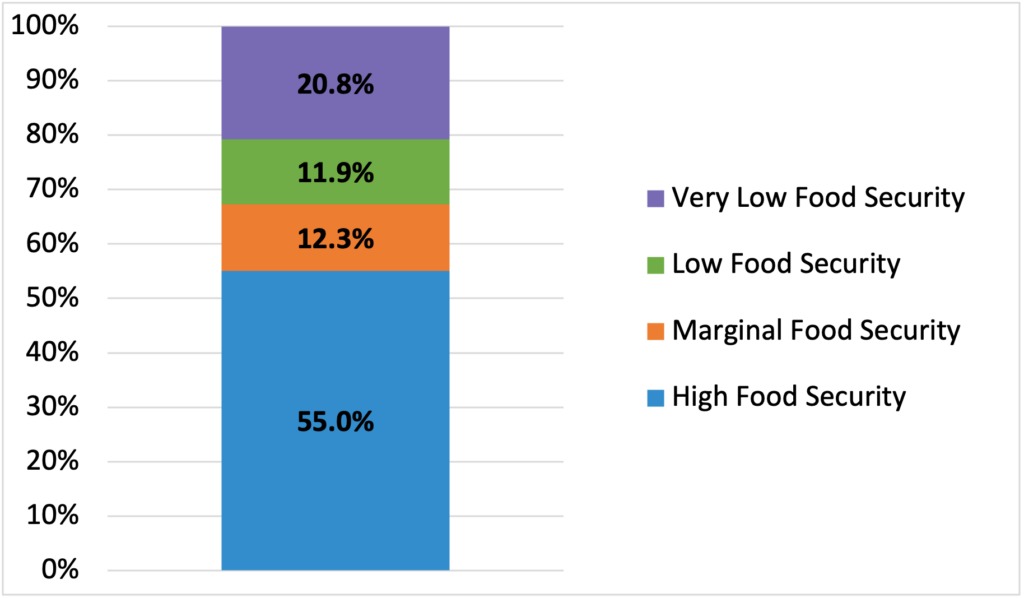
According to the NCR-Stat: Housing and Food Security Survey, 55.0 percent of households are highly food-secure; 12.3 percent are marginally food-secure; 11.9 percent experience low food security; and 20.8 percent fall into the very low food security category (Figure 1). In total, 32.7 percent, nearly one in three households, experience some level of food insecurity.
Figure 1. Food insecurity distribution among the full sample (N = 4,175)
Source: NCR-Stat: Housing and Food Security Survey (Mindes et al., 2026)
III. Income and the Distribution of Food Insecurity
Based on the survey data, food insecurity in the North Central Region appears to vary across income levels. Figure 2 shows the prevalence of food insecurity across income categories. These descriptive patterns show that food insecurity is more prevalent among respondents with lower incomes. This trend aligns with broader research showing income is closely related to food access.
Figure 2. Food security across income levels (N = 2,759)

Source: NCR-Stat: Housing and Food Security Survey (Mindes et al., 2026)
Among all survey respondents, low-income households (annual earnings under $50,000) experience food insecurity at a rate of 43.6 percent, compared to 25.9 percent among middle-income households ($50,000 to $99,999) and 20.9 percent among higher-income households ($100,000 or higher). This gradient illustrates that food insecurity is more common among respondents with lower income, where competing demands like housing, healthcare, and transportation might constrain a household’s ability to consistently secure adequate food.
Taken together, these patterns highlight that income can be associated with food security. Understanding this relationship is essential for interpreting the role of intervention programs. Because financial instability is closely related to food insecurity in broader research, assistance programs, such as SNAP and food stamps, could serve as mechanisms of support to stabilize access to food for the most vulnerable populations. This connection provides a necessary transition into examining how assistance operates within, and sometimes struggles against, these underlying economic realities.
IV. Food Assistance among Food Insecure Households
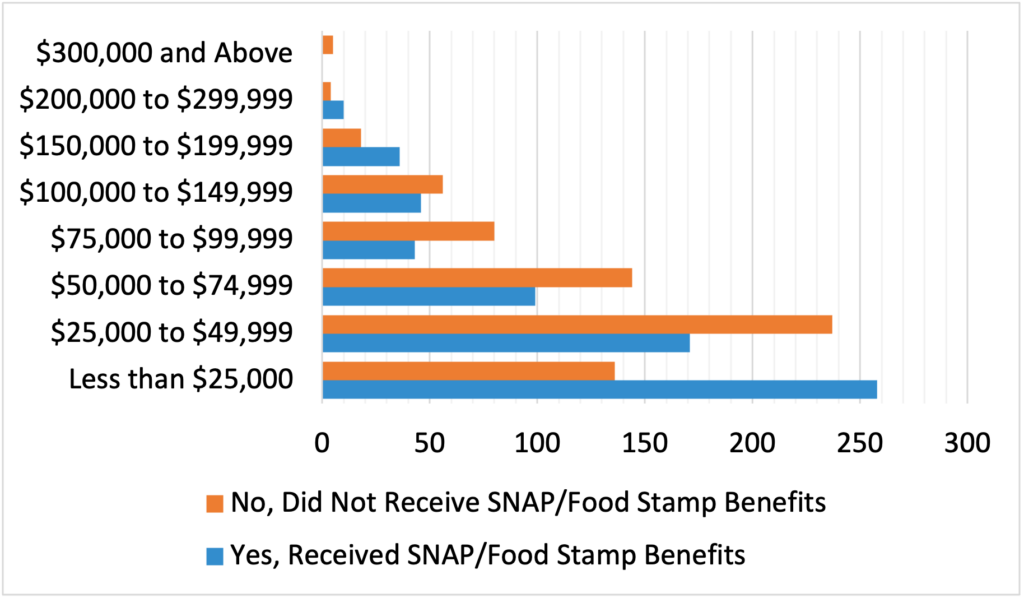
Figure 3 shows SNAP and food stamp participation rates among food‑insecure households, broken out by income level. The chart illustrates how food assistance is used among households that already experience food insecurity. As expected, SNAP participation is highest among the lowest‑income food‑insecure households, but participation is present across all income groups. Because these are descriptive comparisons, they do not indicate whether SNAP reduces food insecurity; they only show how participation is distributed among food‑insecure households.
Figure 3. Use of SNAP/food stamp benefits among food-insecure households by income level (N = 1,343)
Source: NCR-Stat: Housing and Food Security Survey (Mindes et al., 2026)
Among food-insecure households earning less than $25,000, 65.5 percent reported using SNAP or food stamp benefits. Participation declines as income increases: 41.9 percent of food‑insecure households earning $25,000 to $49,999 use SNAP, 40.7 percent in the $50,000 to $74,999 range, and 35.4 percent among those earning $75,000 to $99,999. At higher income levels, participation continues to appear, but sample sizes are smaller, making patterns less stable.
Taken together, these findings reinforce two key insights. First, SNAP is effectively targeted toward households experiencing the greatest financial strain, aligning with the income-based patterns outlined in Section III. Second, food assistance usage is not universal among food-insecure households. Of the 1,343 food-insecure households in the sample, 663 reported using SNAP or food stamps (49.4 percent). Conversely, 15.2 percent of food-secure households also reported using SNAP/food stamps, reflecting eligibility rules that extend beyond food insecurity alone.
In this way, SNAP appears to function as a partial buffer rather than eliminating food insecurity. Food‑insecure households may move along the continuum described in Section II, but many do not fully exit it, and many do not use assistance even when eligible. Because these are descriptive comparisons, they do not indicate whether SNAP reduces food insecurity; they only show how food insecurity is distributed among participants and non‑participants.
V. Implications and Future Pathways
The findings from this analysis position food insecurity in the North Central Region as both widespread and unevenly distributed across the sample. As outlined above, food insecurity reflects a continuum of conditions ranging from uncertainty about food access to more severe disruptions in eating patterns. Within this framework, the data suggest that a substantial portion of households experience some level of instability. These findings highlight the complexity of food insecurity as it is experienced and measured. Rather than appearing as a single, uniform condition, food insecurity reflects overlapping influences related to income, resource allocation, and program participation.
Future research may further examine how these factors interact across different household contexts and how the severity of food insecurity varies within and between income groups. Additional attention to these dynamics may provide greater clarity in understanding how food insecurity is distributed and addressed across the region.
Works Cited
Economic Research Service. (2026). Food Security in the U.S. – Definitions of Food Security. USDA Economic Research Service. https://www.ers.usda.gov/topics/food-nutrition-assistance/food-security-in-the-us/definitions-of-food-security
Mindes, S. C. H., Bednarik, Z., & Mori, S. (2026). North Central Region Household Data. NCR-Stat: Housing and Food Security Survey (Version 1.0, p. 4 files, 4 MB) [Application/pdf,application/vnd.openxmlformats-officedocument.spreadsheetml.sheet,image/png]. Purdue University Research Repository. https://doi.org/10.4231/ZAVR-CE69
About the Authors
Sophie Owens, Undergraduate Research Assistant, Department of Sociology and Criminal Justice, Iowa State University.
Samuel C.H. Mindes, Ph.D., Assistant Professor, Department of Sociology and Criminal Justice, Iowa State University and Fellow, North Central Regional Center for Rural Development
Suggested Citation
Owens, S.; Mindes, S. (2026). Beyond Access: Understanding Food Insecurity in the North Central Region. Research Snapshot. North Central Regional Center for Rural Development. https://doi.org/10.22004/ag.econ.413082.