By Ivanna Carrillo-Siller
Workplace preferences before and after the COVID-19 pandemic
As the world began to shut down at the beginning of 2020 due to the COVID-19 pandemic, many employers started to switch their activities from in-person to remote work. They hoped this decision would prevent the expansion of the unknown disease and protect the health of their employees. Data from the NCR-Stat: Baseline Survey (Bednarikova et al., 2022) is analyzed to observe changes in workplace preferences. [1]
The preference for and access to diverse workplace settings can be driven by different factors, including the employee’s ability to do their work remotely, their type of occupation, broadband and internet access, type of household, and many others. Frequency of pre-pandemic remote work, post-pandemic work site, and preference for remote work frequency by gender, age, and current residential location were analyzed.
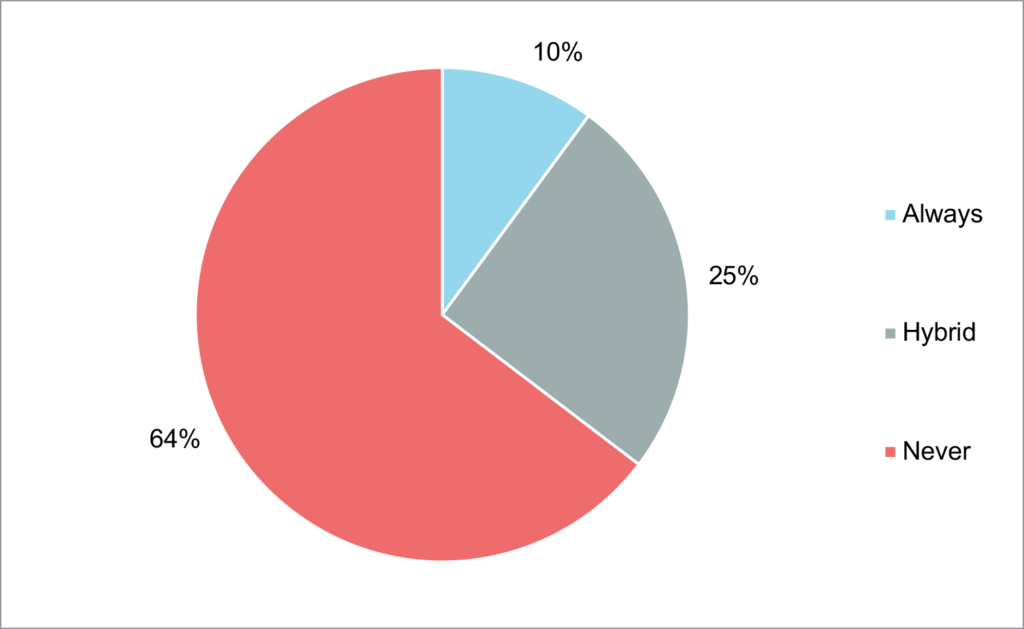
Figure 1 presented below, illustrates frequency of remote work before the pandemic. Most employed respondents (64%) never worked remotely before COVID-19. Ten percent always worked remotely, and 25% worked in a hybrid mode.
Figure 1. How often were employees working remotely before the COVID-19 pandemic in the North Central Region? (N=2,042)
Source: NCR-Stat: Baseline Survey
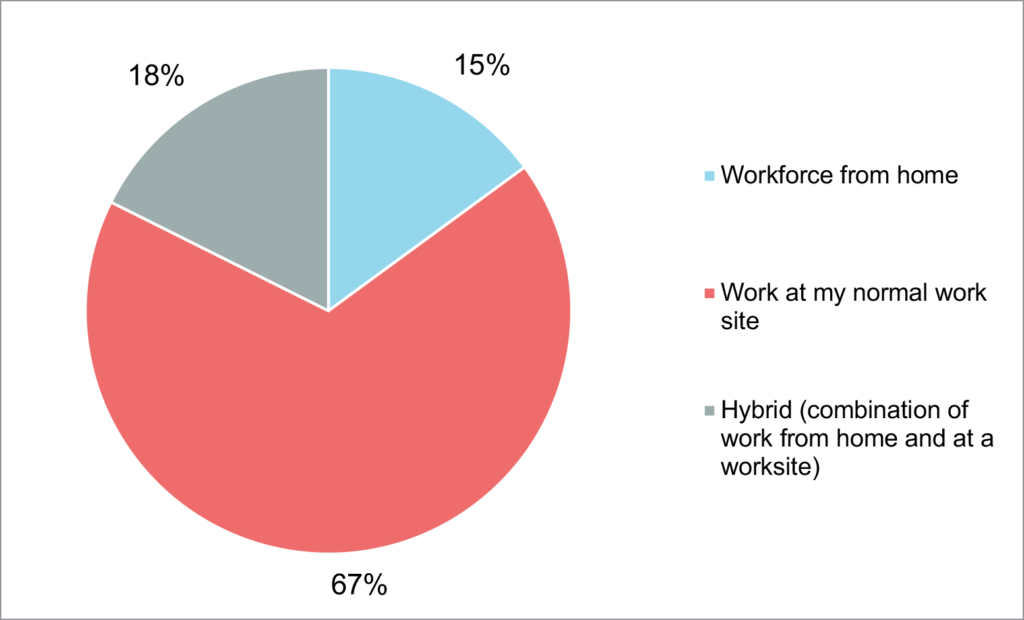
To evaluate how the workplace changed after the pandemic shock, we analyzed where the employed respondents were working in spring 2022 when the survey was conducted (Figure 2). The majority (67%) currently work at their normal workplace, three percentage points more than those who reported never working remotely before COVID-19 (64%). Hybrid working comes as the second largest percentage (18%), that is, a combination of remote and in-person work, which is also a lower than before the pandemic (Figure 1, 25%). Finally, current remote work (15%) shows a slight increase compared to the pre-pandemic workplace setup (10%).
Figure 2. Where were North Central Region employees working in 2022? (N=2,048)
Source: NCR-Stat: Baseline Survey
Workplace preferences
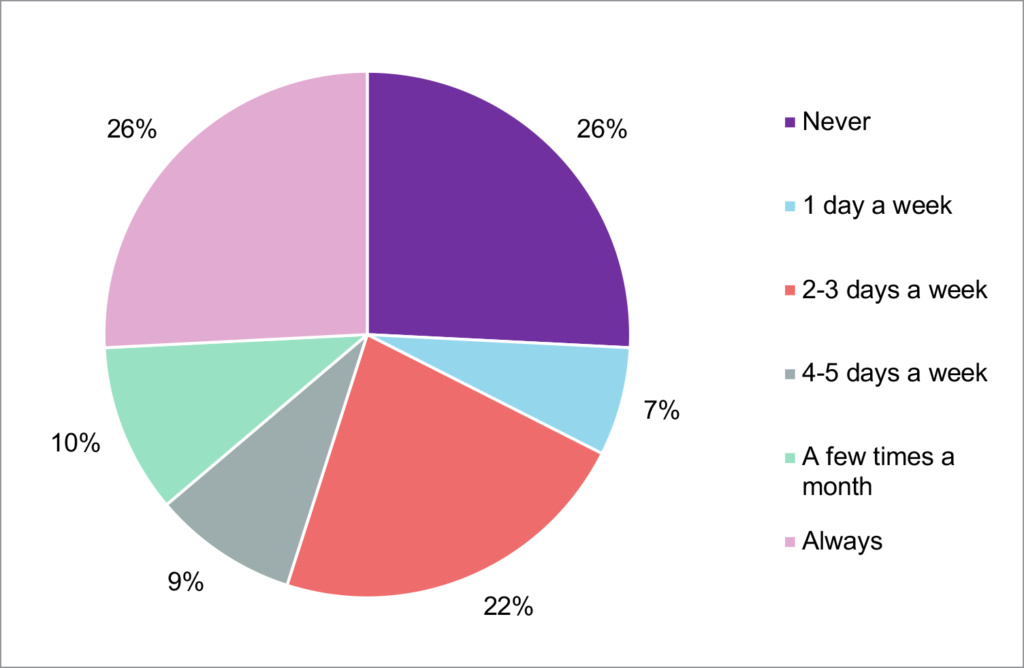
To observe respondents’ preferences regarding their current workplace, employees were asked how often they would prefer to work remotely if employers had a remote work program (Figure 3).
Figure 3. If your employer had a remote work program, how often would you prefer to work remotely? (N=2,039)
Source: NCR-Stat: Baseline Survey
Twenty-six percent of respondents indicated they would prefer to always work remotely. The same share of respondents reported they would never want to work remotely. The second largest group stated they would prefer to work remotely 2-3 days a week (22%). The least number of individuals responded that they would prefer working remotely one day a week (7%). Figure 3 illustrates that up to 74% of employees would prefer hybrid work if such programs were available in their current workplace.
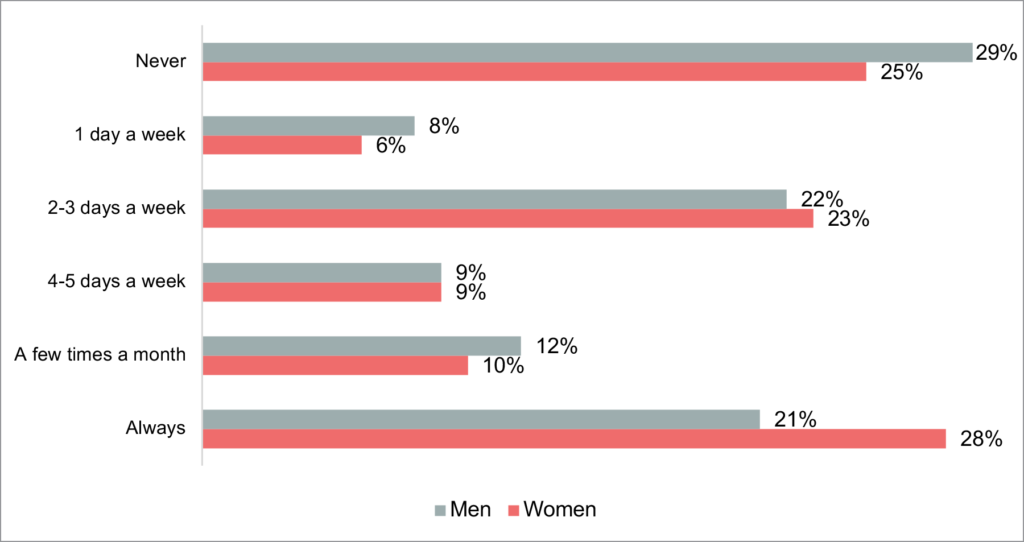
To dive deeper into the characteristics that might drive respondents’ preferences for remote work, we first analyzed responses by gender [2]. Figure 4 shows that women slightly prefer remote work more than men. Women make up a higher percentage of those who would always prefer to work remotely (28%), which is 7% more than their male counterparts. On the other hand, men are a higher percentage of those who would prefer never to work remotely if such a program existed (29%). Nevertheless, 25% of women would choose this option as well. Women take a slight lead in all options offering remote work for more than one day a week (4-5 and 2-3 days a week).
Figure 4. Respondents’ remote work preference by gender (N=2,026)
Source: NCR-Stat: Baseline Survey
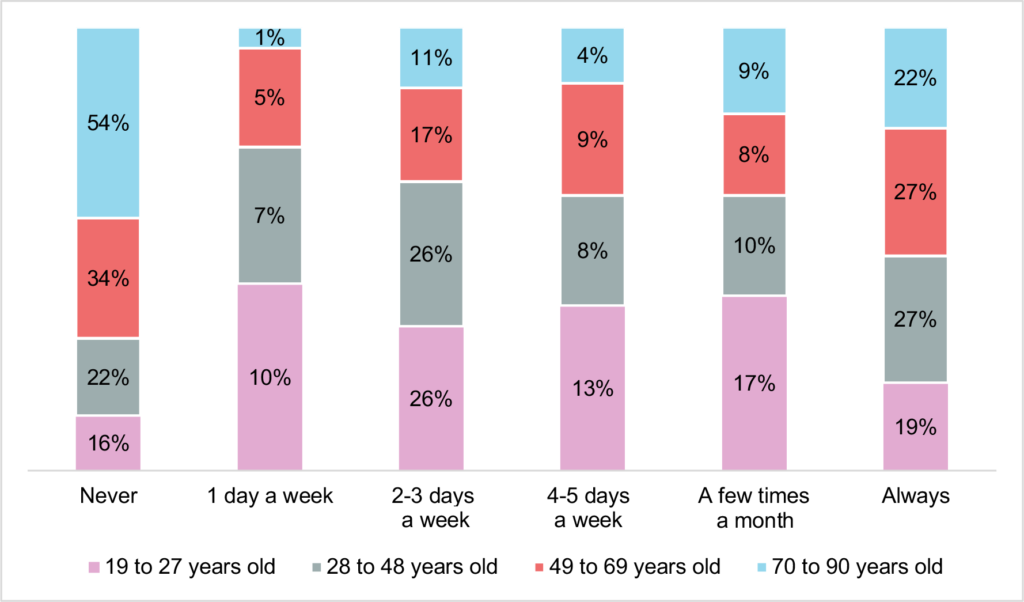
Additionally, we analyzed workplace preference by age (Figure 5). According to Olson et al. (2011) in their study of technology-diffusion information, older adults are less likely to have and use a computer in their household, have greater limited experience with technology devices, systems, and software operation. [3] Furthermore, older adults’ internet usage is frequently limited and shows a lack of expertise and aversion to technology in general.
Figure 5. Respondents’ remote work preference by age (N=2,039)
Source: NCR-Stat: Baseline Survey
Figure 5 displays that more than half of respondents 70 years old and more (54%) prefer never to work remotely, followed by the age category 49 to 69 years old (34%). Willingness for permanent remote work is quite evenly distributed across all age categories ranging between 19% and 27%. From then on, the trend changes, as the younger generations express their higher preferences for remote work. Those from 28 to 48 years old always prefer to work remotely (27%), closely followed by the 2-3 days a week option (26%). Lastly, the youngest generation, 19 to 27 years old, highly prefer 2-3 days a week remote work (26%) and has the least preference for the one day a week category (10%).
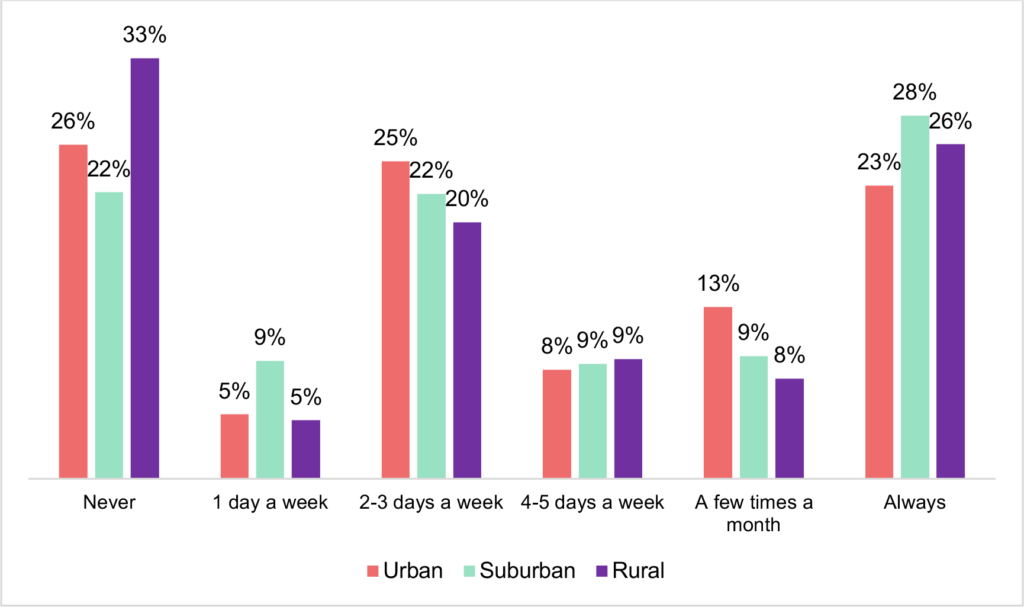
Finally, Figure 6 shows respondents’ workplace preferences by their current residential location. Employees from urban residential locations show a high preference for in-person work (26%) showing the least percentage of preference for a one day a week remote work option (5%). Suburban respondents highly prefer remote work (28%) and least prefer hybrid options (9%). On the other hand, employees from rural areas show the highest preference for in-person work (33%) and show the lowest preference for one day a week remote work (5%), identical to their urban counterparts.
Figure 6. Respondents’ remote work preference by current residential location (N=2,036)
Source: NCR-Stat: Baseline Survey
There were slight differences in preference for working fully remote by residential location. Suburban respondents were slightly higher (28%) followed by rural and urban respondents (26% and 23%, respectively). Employed respondents residing in rural areas reported the highest share of those preferring only in-person work. Only 41% of rural respondents would like a hybrid work model.
Our analysis shows several interesting findings, especially regarding workplace preference according to gender and residential location. We found gender differences in preference for remote work frequency. Contrary to our expectations, we found that rural residents prefer in-person work model over remote work models.
References
[1] Bednarikova, Z.; Marshall, M.I.; Wiatt, R. D.; Wilcox, Jr, M.D. (2022). North Central Region Household Data (NCR-Stat): Baseline Survey. Purdue University Research Repository.
[2] Due to the low number of respondents, this analysis doesn’t include individuals who reported being non-binary.
[3] Olson K., O’Brien M., Rogers W., Charness N. (2011). Diffusion of Technology: Frequency of Use for Younger and Older Adults. Ageing International, PMC Pub Med, National Library of Medicine, 36(1): 123-145.
Author
Ivanna Carrillo-Siller, Graduate Research Assistant, North Central Regional Center for Rural Development
Download article
Suggested citation
Carrillo-Siller, I. (2023, June 6). How COVID-19 Changed Workforce Participation Preferences in the North Central Region. North Central Regional Center for Rural Development. https://ncrcrd.ag.purdue.edu/2023/09/18/how-covid-changed-workforce-preferences/
