By Antara Chowdhury
The NCR-Stat: Baseline Survey includes a section related to community food security in the North Central Region (NCR).[1] Survey participants were asked how often they ran out of food before household members had money to buy more in the last 12 months. This article evaluates participants’ responses based on their demographic characteristics.
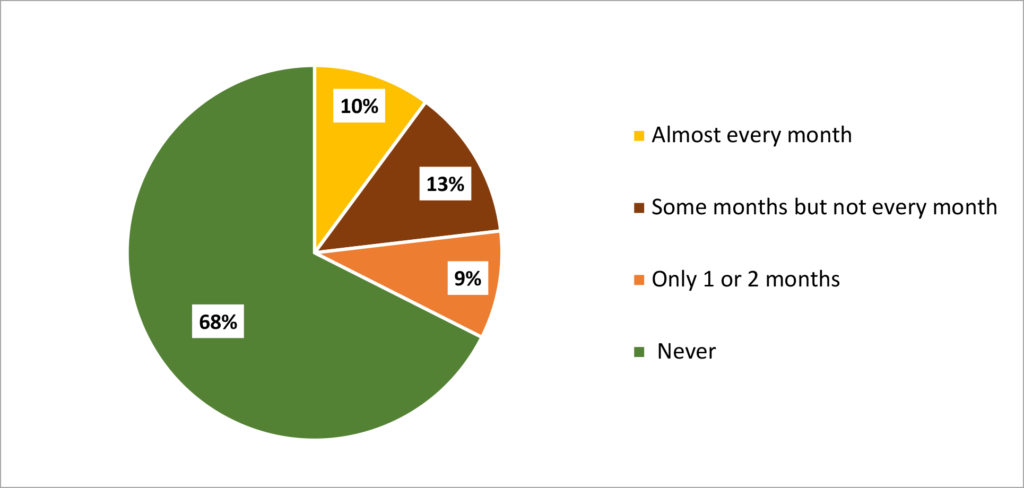
Figure 1 shows that most participants (68%) never ran out of food before they had money to buy more food. On the other hand, 10% said they ran out of food almost every month in the last 12 months. Around 22% of respondents reported that their household ran out of food at least one month in the last 12 months.
Figure 1: The households’ frequency of running out of food in the last 12 months in the North Central Region (N=4,608)
Source: NCR-Stat: Baseline Survey, 2022
The respondents from nonfamily [2] households less often never ran out of food in the last 12 months than family households (69% and 67%, respectively). Also, 33% of family households reported running out of food for at least one or two months in the mentioned period compared to 31% of their nonfamily counterparts.
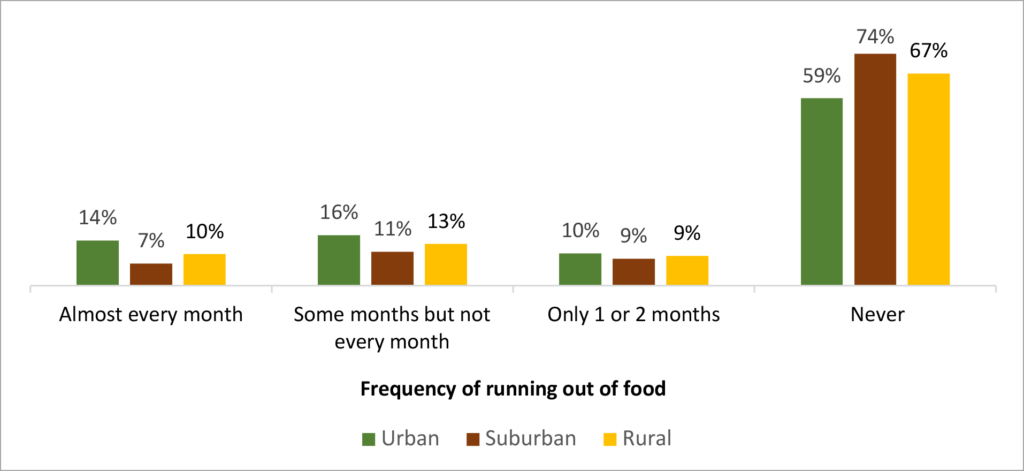
Figure 2 indicates that urban respondents run out of food more often than rural and suburban respondents.[3] Suburban residents have the highest share of those who never ran out of food in the last 12 months (74%) compared to rural (67%) and urban (59%) respondents.
Figure 2: The households’ frequency of running out of food in the last 12 months in the North Central Region by a residential location (N=4,599)
Source: NCR-Stat: Baseline Survey, 2022
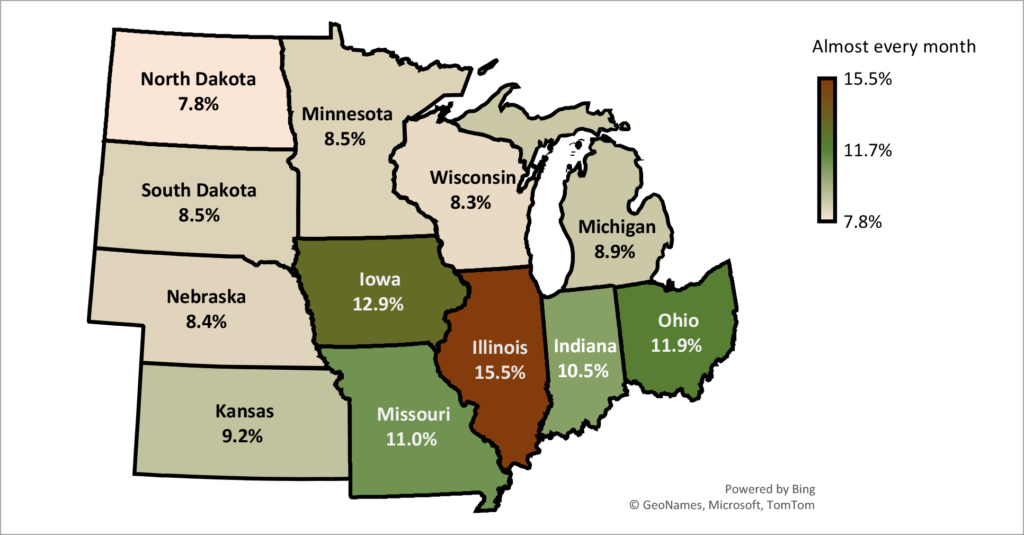
Figure 3 shows the comparison of the NCR states based on the percentage of respondents who ran out of food almost every month. 15.5 percent of respondents from Illinois ran out of food almost every month in the last 12 months, which is the highest percentage among the 12 states. Iowa showed the 2nd highest share (12.9%) in the same period, while North Dakota, Wisconsin, and Nebraska reached the lowest share of 7.8%, 8.3 % and 8.4 % respectively.
Figure 3: Percentage of respondents who ran out of food almost every month in the North Central Region by state (N= 4,608)
Source: NCR-Stat: Baseline Survey, 2022
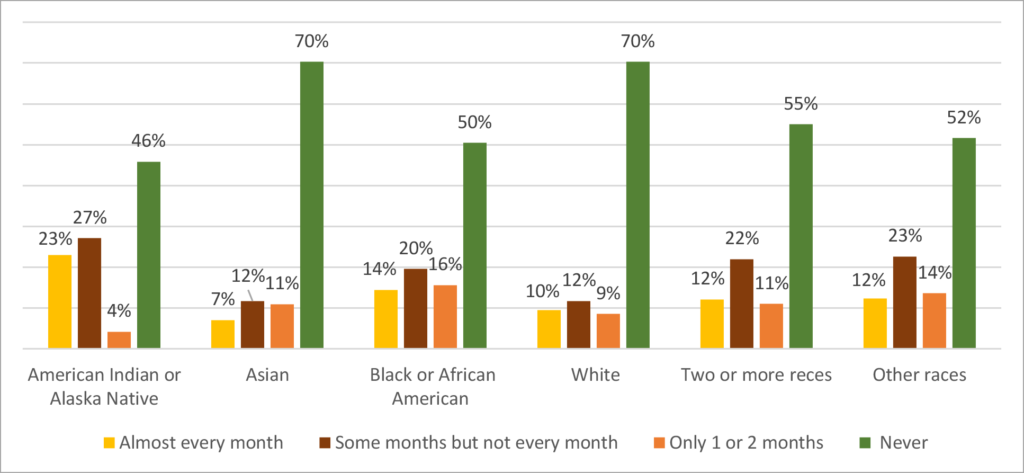
Figure 4 indicates that Asian and White respondents have the highest number of households (70%) that never ran out of food in the last 12 months. The respondents also show similar results in the frequency of running out of food. American Indian or Alaska Native respondents reported the highest rate of households running out of food almost every month (23%) and some months (27%).
Figure 4: The households’ frequency of running out of food in the last 12 months in the North Central Region by race (N= 4,595)
Source: NCR-Stat: Baseline Survey, 2022
Survey results suggest that Not Hispanic or Latino households have a lower percentage of those running out of food than Hispanic or Latino households (31% and 51%, respectively).
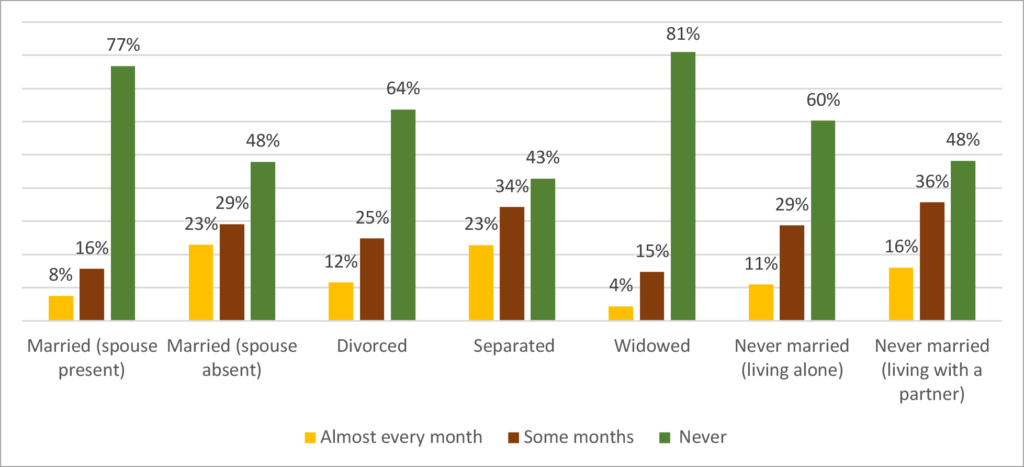
Figure 5 shows that married respondents with absent spouses and respondents living separately from their spouses indicated the highest share of running out of food almost every month (23%). In contrast, widowed respondents represent the group with the highest percentage (81%) of those who never ran out of food in the last 12 months, followed by married respondents with spouses present (77%).
Figure 5: The households’ frequency of running out of food in the North Central Region by marital status (N=4,577)
Source: NCR-Stat: Baseline Survey, 2022
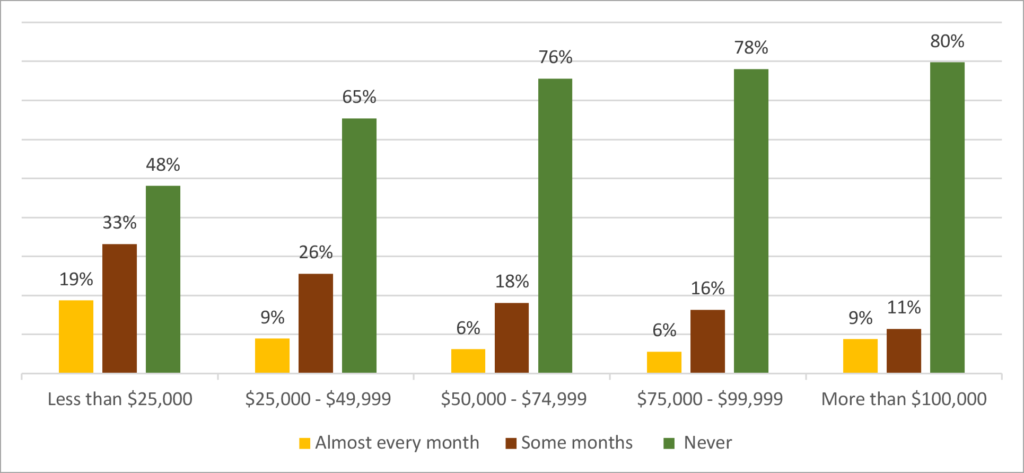
Survey results revealed that 86% of respondents have a combined household income below $100,000 per year. Figure 6 shows a relationship between the level of the total household income and the frequency of running out of food. Higher income households are less likely to run out of food. Households with an income of less than $25,000 have the highest rate of those running out of food almost every month (19%) or some months (33%). Households with a total income of more than $100,000 have the highest frequency (80%) of never running out of food.
Figure 6: The households’ frequency of running out of food in the last 12 months in the North Central Region by household income (N=4,453)
Source: NCR-Stat: Baseline Survey, 2022
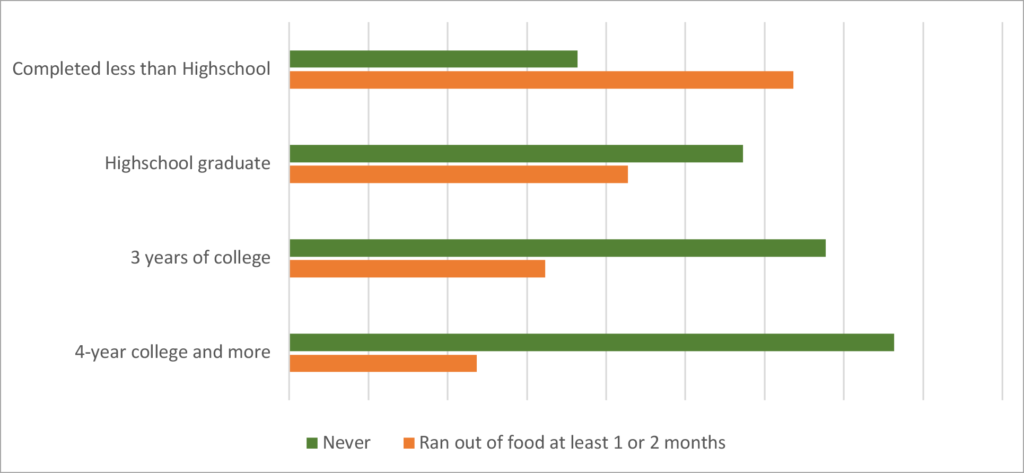
We examined the impact of education on food security by creating two categories – those who at least once within the last 12 months ran out of food and those who never ran out of food. The data suggest there is a positive correlation between education and food security. Figure 7 shows that respondents who did not complete high school experience a higher rate of running out of food (64%). Respondents who completed four years of college have the lowest frequency of running out of food at least one month per year (24%).
Figure 7: The households’ frequency of running out of food in the last 12 months in the North Central Region by educational attainment (N=4,600)
Source: NCR-Stat: Baseline Survey, 2022
Summary
The survey analysis revealed that several factors may be correlated with household food security. Separated and married (partner absent) householders reported having more food shortages in the last 12 months. Households in urban areas also reported running out of food more often than rural and suburban households. The share of households that run out of food is lower in households with a higher income level. Food security decreases with increasing educational attainment.
References
[1] Bednarikova, Z.; Marshall, M. I.; Wiatt, R. D.; Wilcox, Jr, M. D. (2022). North Central Region Household Data (NCR-Stat): Baseline Survey. Purdue University Research Repository. doi:10.4231/2DEM-Z333
[2] We define a nonfamily household consists of a householder living alone or with nonrelatives only, for example, with roommates or an unmarried partner. A family household consists of a householder and one or more other people living in the same household who are related to the householder by birth, marriage, or adoption.
[3] We define an urban area as an urbanized area, such as a city, town, or metropolitan area; a suburban area as the outskirts of a city or town, an outlying area economically tied to an urban area and within commuting distance; and a rural area as open and/or sparsely populated countryside, not within commuting distance to urban or suburban areas.
Author
Antara Chowdhury, Graduate Research Assistant, North Central Regional Center for Rural Development
Download article
Suggested citation
Chowdhury, A. (2023, June 6). How Often do North Central Region Households Run Out of Food? North Central Regional Center for Rural Development. https://ncrcrd.ag.purdue.edu/2023/06/05/how-often-do-households-in-the-north-central-region-run-out-of-food/
