By Ivanna Carrillo-Siller
The NCR-Stat Baseline Survey includes several questions related to perception of diversity, equity, and inclusion in North Central Region (NCR) communities.[1] Respondents were asked to what extent they agree with the statement that their community provides equal access to employment opportunities for residents of all backgrounds by choosing ‘strongly agree,’ ‘agree,’ ‘neutral,’ ‘disagree,’ and ‘strongly disagree.’ Throughout this analysis, the responses reporting ‘Strongly agree’ and ‘Agree’ are grouped in a single category ‘Agree’, ‘Strongly disagree’ and ‘Disagree’ in a single category ‘Disagree,’ while ‘Neutral’ stays without changes.
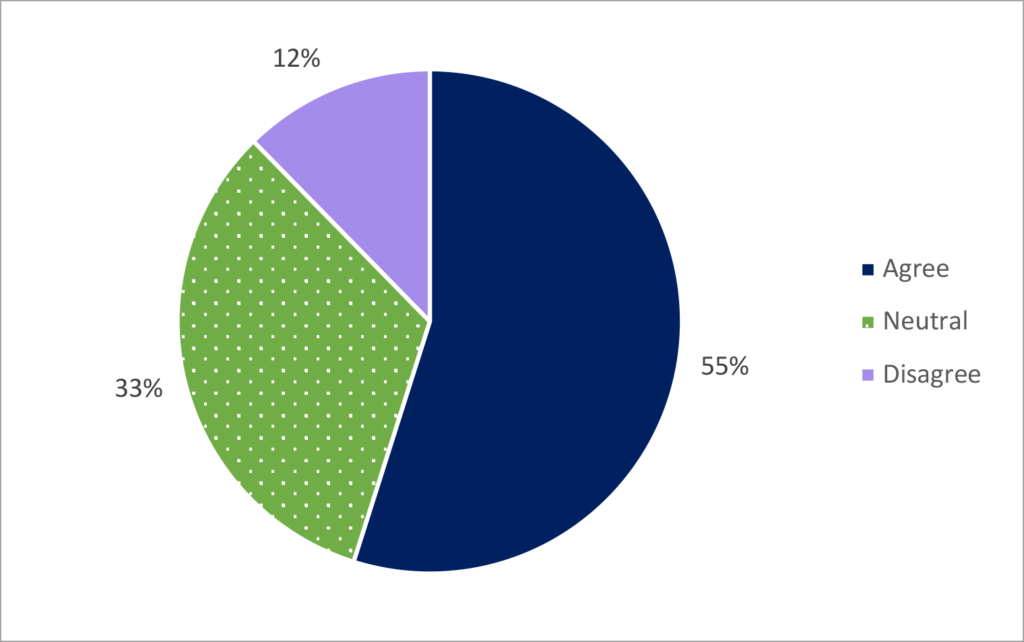
Figure 1 shows that most respondents (55%) agree that equal employment opportunities for residents of all backgrounds exist in their local communities, a third of respondents remain neutral, and 12% of respondents disagree with the statement.
Figure 1. Perception of equal access to employment opportunities in the North Central Region (N=4,624)
Source: NCR-Stat Baseline Survey, 2022
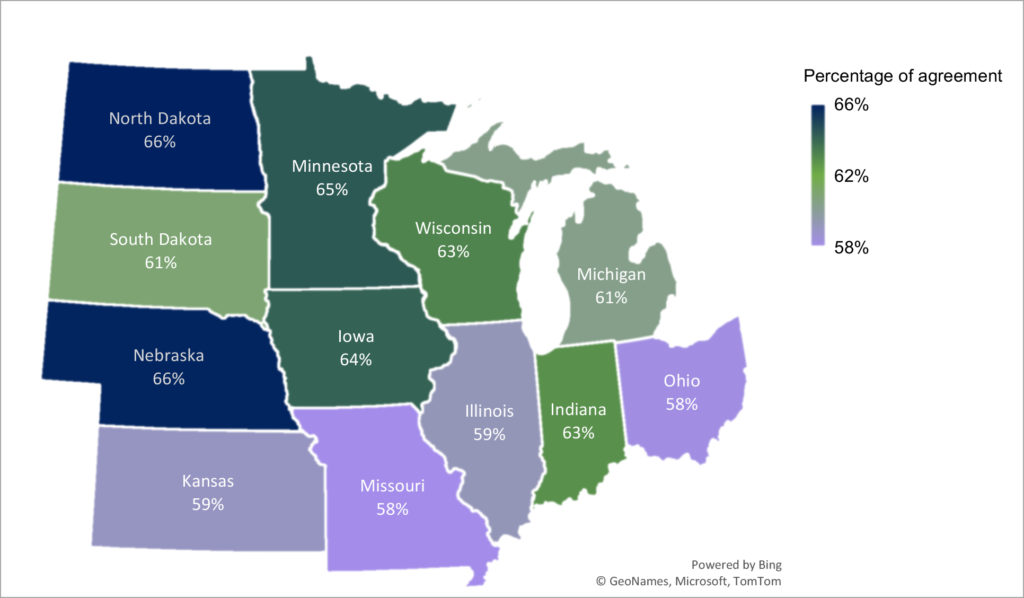
Figure 2 shows the distribution of respondents by state that agree there are equal employment opportunities in their community. The shares of agreements range between 58% and 66% showing consistency in the perception of equal employment opportunities in the NCR. North Dakota and Nebraska (66%) have the highest percentage of agreement, followed by Minnesota (65%), Iowa (64%), Indiana, and Wisconsin (63%). The lowest agreement percentages are in Missouri and Ohio (58%).
Figure 2. Percent of North Central Region respondents who agree with equal access to employment opportunities by state (N=4,194)
Source: NCR-Stat Baseline Survey, 2022
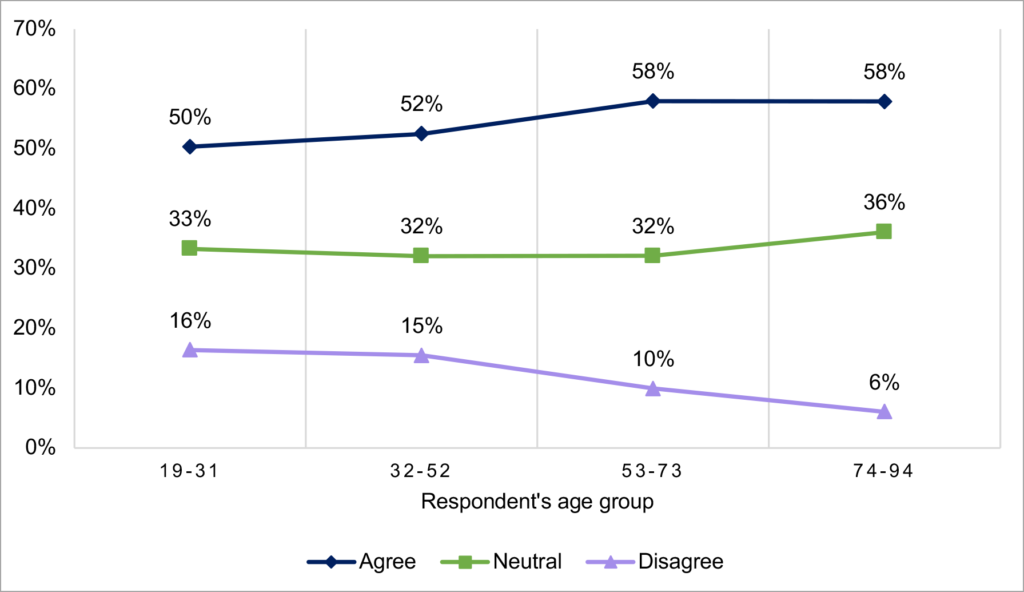
To gain further insight into equal employment perception for all residents, the statement is analyzed by age in Figure 3. There are noticeable perception patterns across the four age ranges. Agreement with the statement falls as respondents’ age decreases, from 58% of respondents between 74 and 94 years old to 50% of respondents between 19 and 31 years old. Disagreement shows a reverse trend, increasing from 6% of the oldest respondents to 16% of the youngest age group. Neutral responses remain rather consistent throughout the age categories but show a slightly decreasing pattern among younger respondents.
Figure 3. Perception of equal access to employment opportunities in the North Central Region by age (N=4,624)
Source: NCR-Stat Baseline Survey, 2022
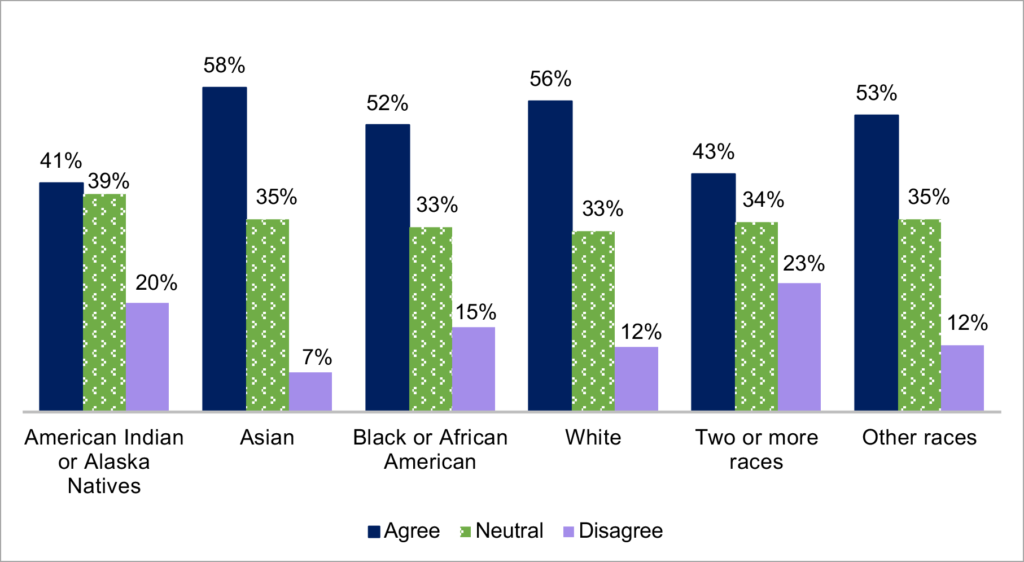
Regarding respondents’ race, Figure 4 shows that Asian and White respondents have the highest percentage of agreement with the statement that equal employment opportunities are provided (58% and 56%, respectively), closely followed by respondents that chose ‘Other races’ [2] (53%) and Black or African American respondents (52%). Less than half of American Indian or Alaska Natives respondents agree with equal employment opportunities and represent the group with the lowest share of agreement (41%).
Figure 4. Perception of equal access to employment opportunities in the North Central Region by respondents’ race (N=4,624)
Source: NCR-Stat Baseline Survey, 2022
The number of respondents of all races that remain neutral to the question has a short range from 33% for Black or African American and White respondents to 39% for American Indian or Alaska Natives respondents. Asian respondents have the lowest percentage of disagreement (7%), followed by the categories White and Other races (12% for both). The Two or more races and American Indian or Alaska Natives groups of respondents represent the highest percentage of disagreement, with 23% and 20%, respectively.
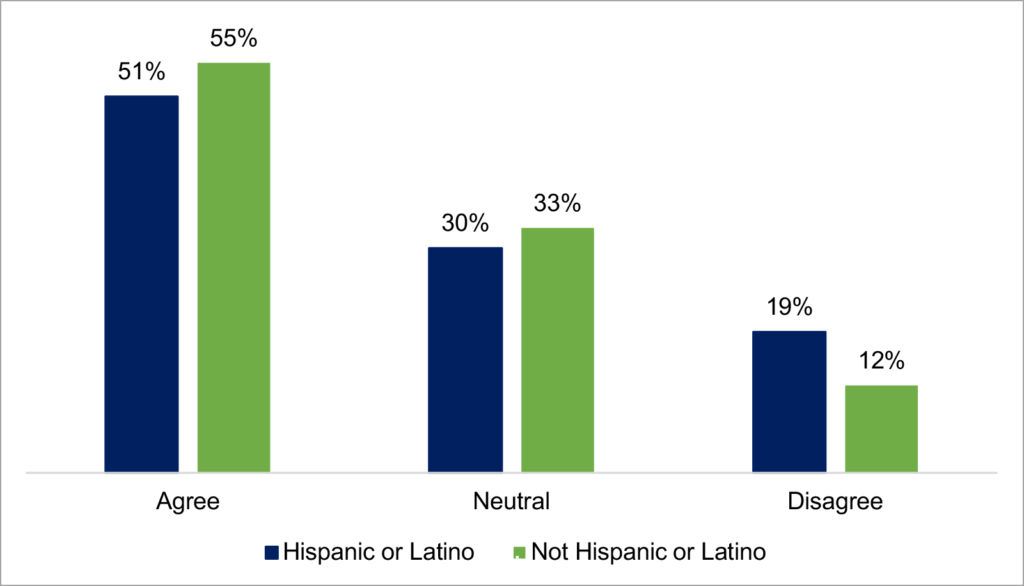
As an important demographic aspect, Figure 5 shows respondents’ perception of equal access to employment opportunities by ethnicity. Non-Hispanic or Latino respondents agree and remain neutral in a higher percentage than their Hispanic or Latino counterparts, with 55% and 33%, respectively. Hispanic or Latino respondents disagree more (19%) than Non-Hispanic or Latino (12%) on whether such equality exists in their communities.
Figure 5. Perception of equal access to employment opportunities in the North Central Region by respondents’ ethnicity (N=4,624)
Source: NCR-Stat Baseline Survey, 2022
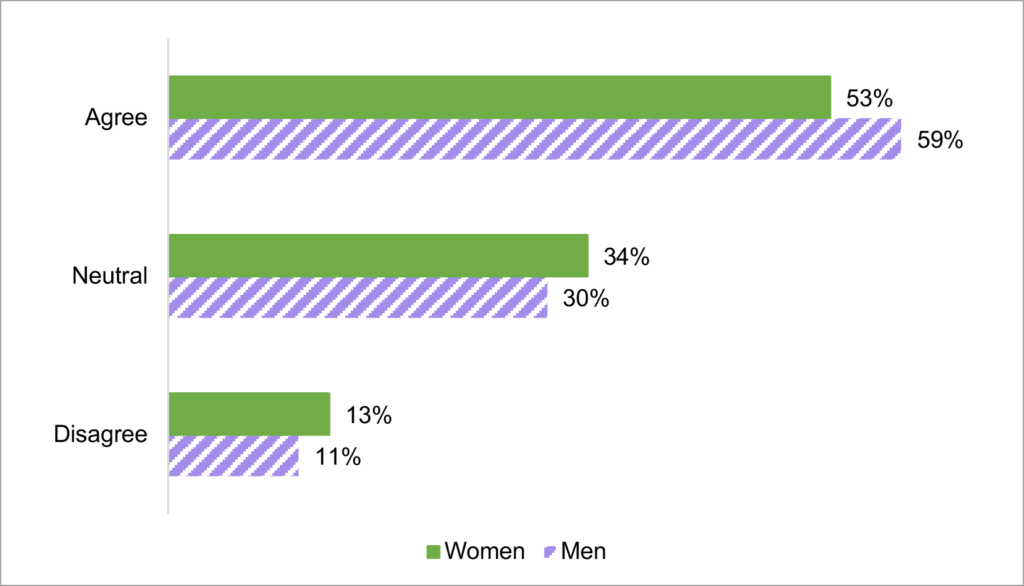
In Figure 6, respondents’ perception of equal access to employment opportunities is analyzed by gender [3]. More men (59%) than women (53%) agree that equality in employment opportunities exists for all residents. On the other hand, a higher share of women than men are neutral to or disagree that employment equality is present in their local communities.
Figure 6. Perception of equal access to employment opportunities in the North Central Region by respondents’ gender (N=4,599)
Source: NCR-Stat Baseline Survey, 2022
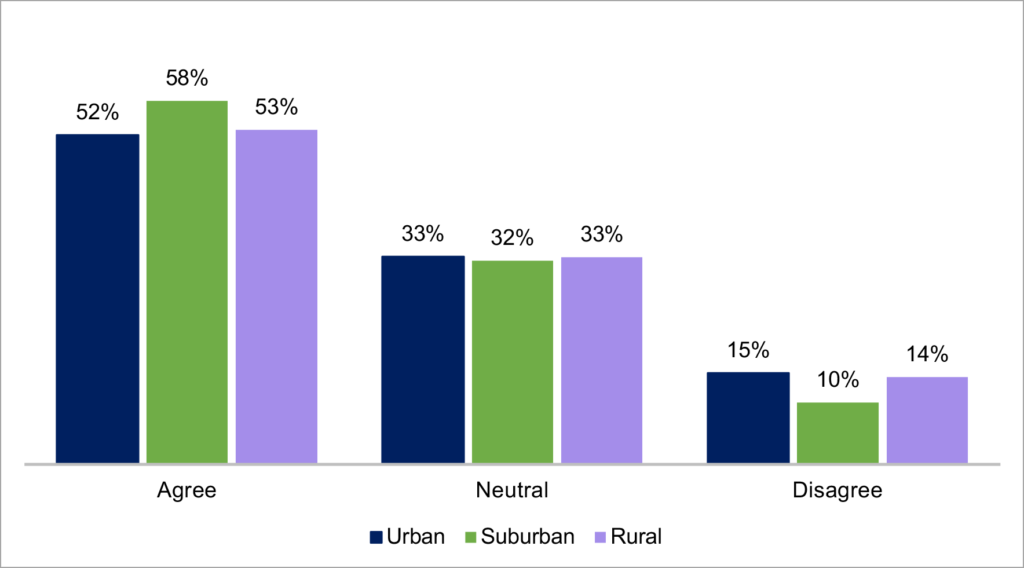
Regarding household location, responses are analyzed by communities’ location in urban, suburban, or rural areas. Figure 7 shows that the distribution of responses remains somewhat consistent across all three types of locations. The main difference can be noticed in the percentage of agreement. Suburban respondents agree more with the statement (58%) than respondents from urban and rural communities (52% and 53%, respectively). On the other hand, urban respondents take the lead on disagreement (15%), closely followed by rural (14%) Suburban communities disagree the least (10%) with the statement.
Figure 7. Perception of equal access to employment opportunities in the North Central Region by respondents’ current residential location (N=4,616)
Source: NCR-Stat Baseline Survey, 2022
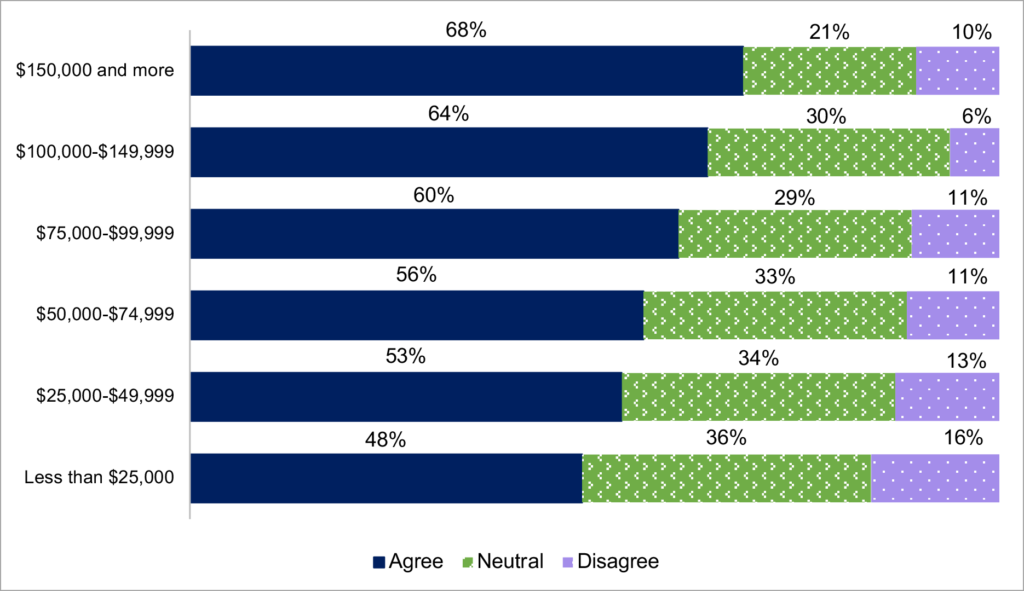
To learn more about respondents’ perception of equal access to employment opportunities in their local communities, Figure 8 shows the perception of agreement with employment equality by total household income. Agreement increases with total household income and ranges from 48% in the lowest income category of $25,000 and less to 68% in the highest income category of $150,000 and more. This result indicates that household income might play a role in respondents’ perception of equal employment opportunities in their communities.
Figure 8. Perception of equal access to employment opportunities in the North Central Region by total household income (N=4,470)
Source: NCR-Stat Baseline Survey, 2022
References
[1] Bednarikova, Z.; Marshall, M. I.; Wiatt, R. D.; Wilcox, Jr, M. D. (2022). North Central Region Household Data (NCR-Stat): Baseline Survey. Purdue University Research Repository. doi:10.4231/2DEM-Z333
[2] Due to the low number of respondents identifying themselves as Native Hawaiian and Other Pacific Islanders, they were included in ‘Other races’ in this analysis.
[3] Our analysis does not include those who reported being non-binary as the number of respondents was too low to be analyzed.
Author
Ivanna Carrillo-Siller, Graduate Research Assistant, North Central Regional Center for Rural Development
Download article
Suggested citation
Carrillo-Siller, I. (2023, June 6). Perception of Equal Employment Opportunities in Communities of the North Central Region. North Central Regional Center for Rural Development. https://ncrcrd.ag.purdue.edu/2023/06/02/perception-of-equal-employment-opportunities-in-communities-of-the-north-central-region/
