By Alejandra Armesto Gómez
In the 2022 NCR-Stat: Baseline Survey, the North Central Regional Center for Rural Development (NCRCRD) included a range of questions focused on diversity, equity, and inclusion in the North Central Region (NCR).[1] Respondents were asked about their level of agreement with the statement that their local communities treat all residents fairly.
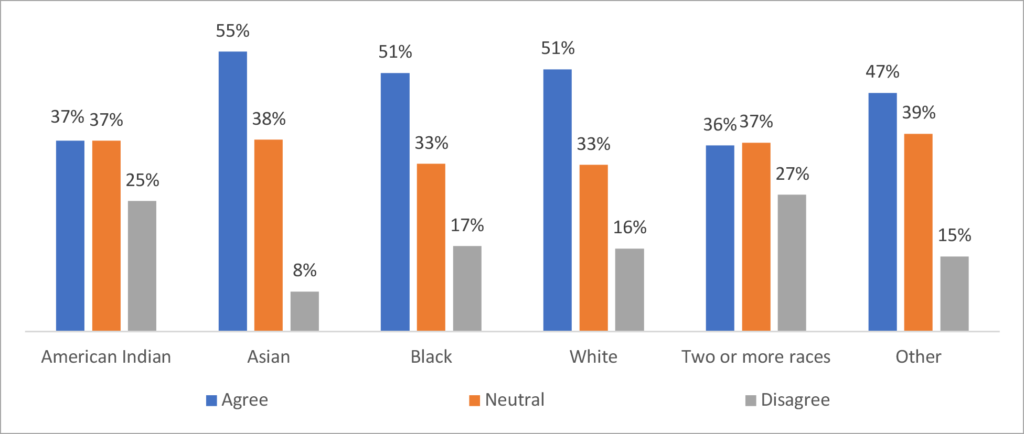
Figure 1 shows that respondents regardless of race either agree with or are neutral toward the statement that their local communities treat all the residents fairly. A closer look at the responses by race suggests that a higher share of Asian respondents (55%) agree with this affirmation. White and Black respondents share the same overall perceptions about their communities treating all residents fairly. Of the respondents that selected other 47% agreed that their communities treat all residents fairly. American Indians and Alaska Natives and respondents reporting two or more races have a similar perception about their communities and are more likely to disagree that all residents are treated fairly in their communities.
Figure 1. Responses by race to the statement: My local community treats all residents fairly(N=4,625)
Source: NCR-Stat Baseline Survey, 2022
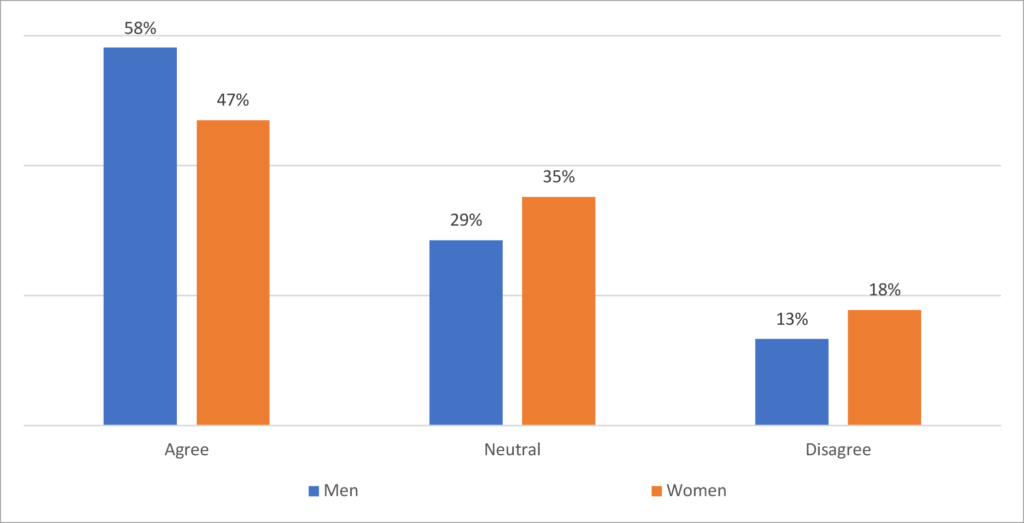
Figure 2 demonstrates the gender differences in perceptions of community fairness. More men (58%) than women (47%) agree that their local community treats all residents fairly. Likewise, women have a higher share in the neutral (35%) and disagree (18%) categories compared to men (29% and 13%, respectively).[2]
Figure 2. Responses by gender to the statement: My local community treats all residents fairly (N=4,600)
Source: NCR-Stat Baseline Survey, 2022
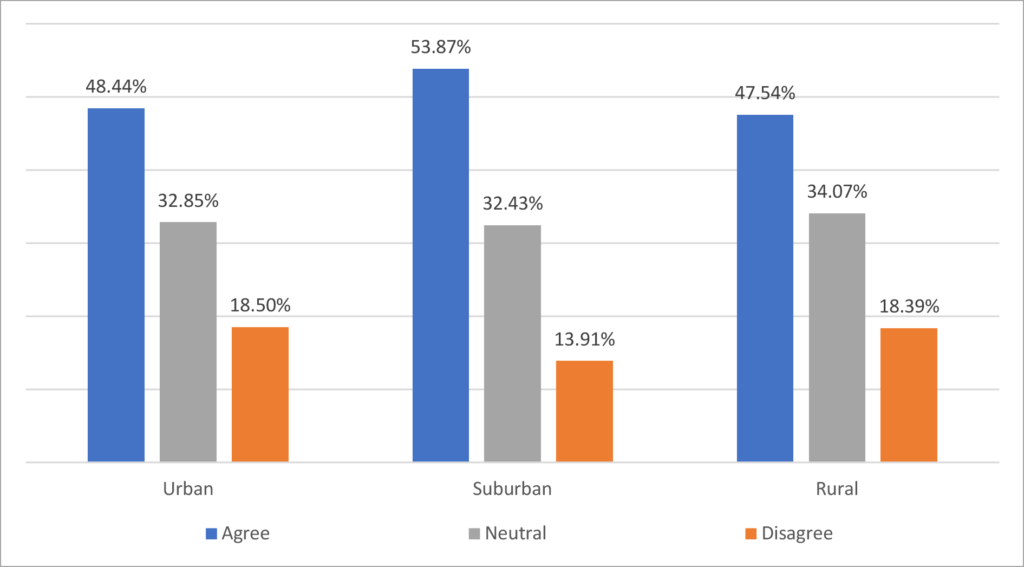
Figure 3 displays how fair the respondents feel residents are treated by their local communities based on household location. Rural and urban respondents have similar overall perceptions about how residents are treated in their communities. A higher share of suburban respondents (54%) agreed that all residents in their communities are treated fairly compared to their urban (48%) and rural counterparts (48%).
Figure 3. Responses by household location to the statement: My local community treats all residents fairly (N=4,616)
Source: NCR-Stat Baseline Survey, 2022
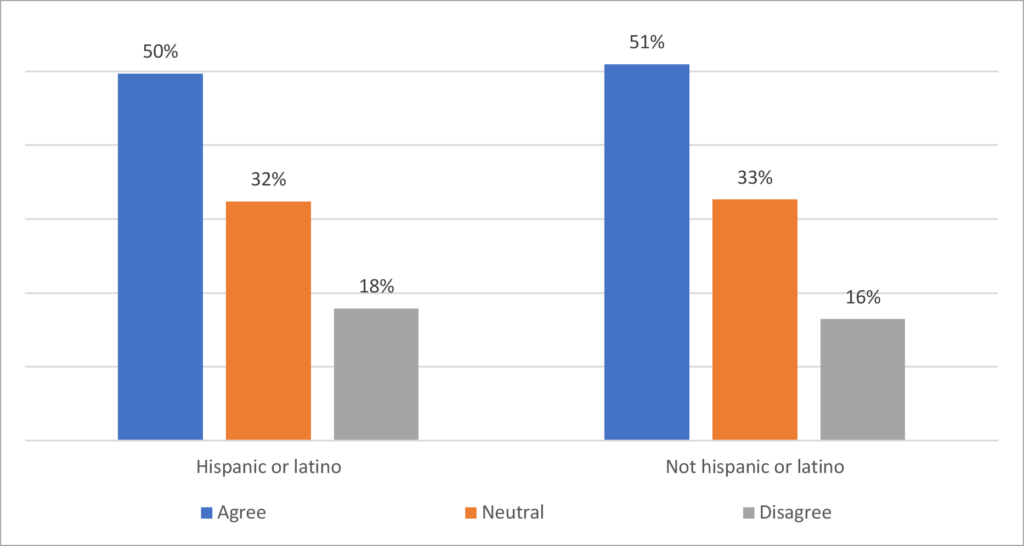
Concerning the perception of fairness of the Hispanic or Latino respondents within their local community, Figure 4 shows that half of the respondents agree with the statement. Overall, the responses of this ethnic group are very similar to responses reported by not Hispanic or Latino group.
Figure 4. Responses by ethnicity to the statement: My local community treats all residents fairly (N=4,625)
Source: NCR-Stat Baseline Survey, 2022
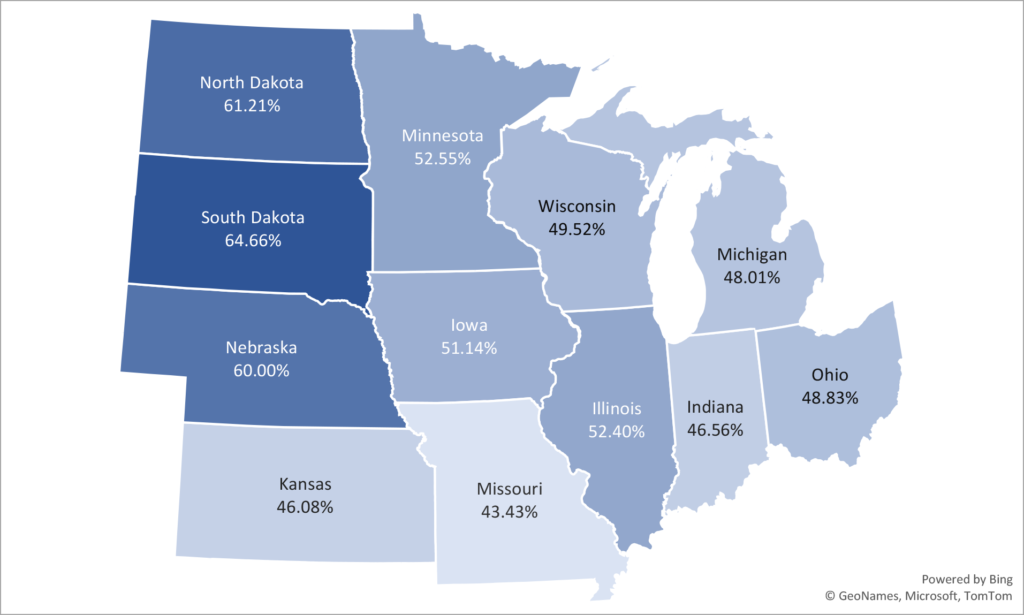
Figure 5 shows that the share of respondents that agree with the statement their local community treats all residents fairly differ in NCR states. This ranges between 65% by South Dakota with the highest percentage and 43% by Missouri with the lowest. In addition, we can see from Figure 5 that the Dakotas and Nebraska have a higher percentage of agreement than the other nine states in the region.
Figure 5. Responses by State to the statement: My local community treats all residents fairly – Share of respondents that agree by state (N=4,188)
Source: NCR-Stat Baseline Survey, 2022
Conclusion
The results of the NCR-Stat: Baseline Survey reveal that the perception of fairness within a local community can vary based race, gender, ethnicity, household location, and state. More information about the survey or the data can be found on the NCR-Stat webpage
References
[1] Bednarikova, Z.; Marshall, M. I.; Wiatt, R. D.; Wilcox, Jr, M. D. (2022). North Central Region Household Data (NCR-Stat): Baseline Survey. Purdue University Research Repository. doi:10.4231/2DEM-Z333
[2] Non-Binary respondents were also asked about their opinion regarding the statement. Yet, since the number of respondents was very low, we did not include their responses in the analysis.
Author
Alejandra Armesto Gómez, Graduate Research Assistant, North Central Regional Center for Rural Development
Download article
Suggested citation
Armesto Gómez, A. (2023, May 1). Does Your Local Community Treat All Residents Fairly? Perspectives from the North Central Region. North Central Regional Center for Rural Development.https://ncrcrd.ag.purdue.edu/2023/05/31/does-your-local-community-treat-all-residents-fairly-perspectives-from-the-north-central-region/
