By Alejandra Armesto Gómez
In the 2022 NCR-Stat: Baseline Survey, the North Central Regional Center for Rural Development (NCRCRD) included a range of questions focused on diversity, equity, and inclusion in the North Central Region (NCR). [1] Respondents were asked about their perception regarding the respect for residents of different cultures and belief systems demonstrated by their communities.
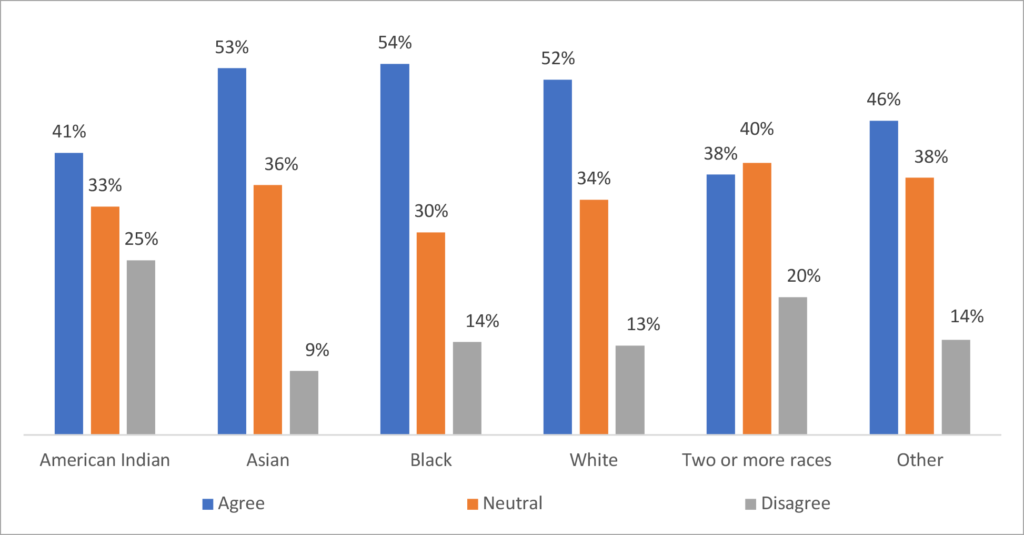
Figure 1 shows the shares of respondents who agreed with the statement that their local communities respect different cultures and beliefs. The respondents with the highest percentage of ‘agree’ responses identified as Black, Asian, and White. The respondents who identified as two or more races were more neutral about this statement. Finally, the respondents that disagreed the most identified as American Indian or Alaskan Native.
Figure 1. Responses by race to the statement: My local community demonstrates respect for residents of different cultures and belief systems (N=4,622)
Source: NCR-Stat Baseline Survey, 2022
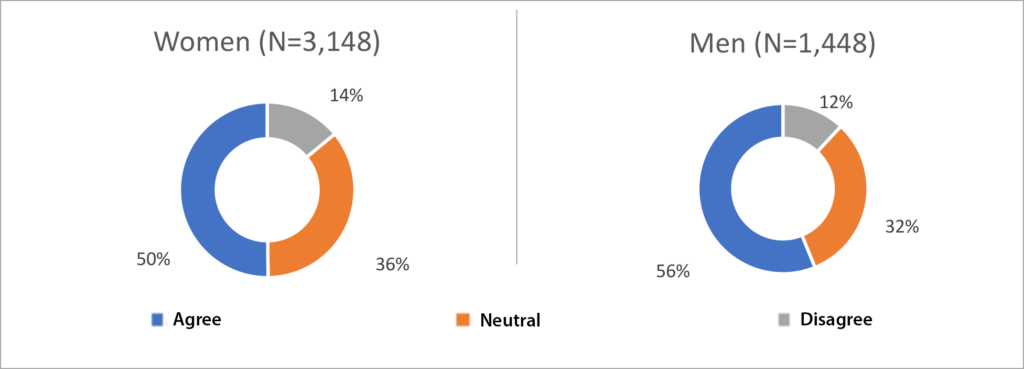
As shown in Figure 2, the shares related to the perception of men and women have similar behavior regarding their perception of respect for residents of different cultures and belief systems. Both genders have a high share in the ‘Agree’ category, with 50% for women and 56% for men. However, women had more responses in the ‘Neutral’ and ‘Disagree’ categories.[2]
Figure 2. Responses by gender to the statement: My local community demonstrates respect for residents of different cultures and belief systems (N=4,596)
Source: NCR-Stat Baseline Survey, 2022
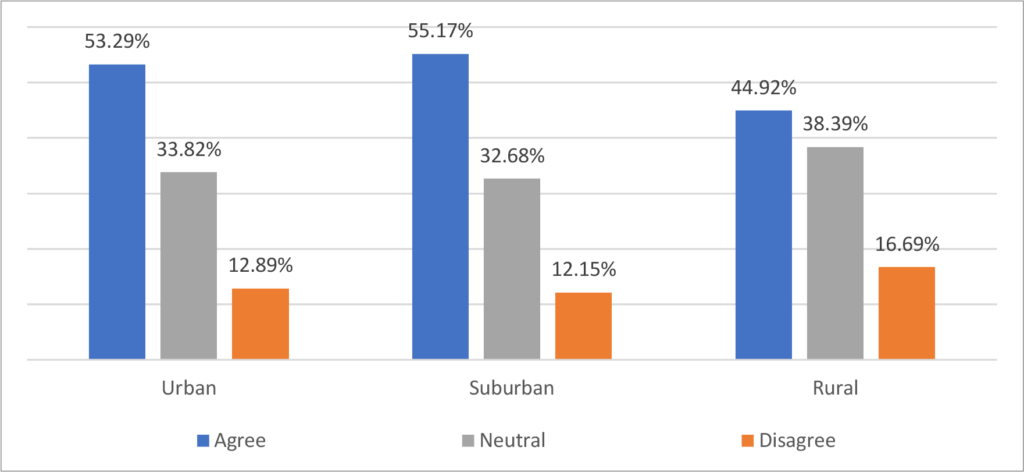
When it comes to analyzing the perception of residents from urban, suburban, and rural localities about the respect that their local communities show for different cultures and belief systems, it can be noted that all three types of localities have the highest shares into the ‘Agree’ responses. However, as Figure 3 shows, respondents located in a rural area have a more uniform distribution with their responses.
Figure 3. Responses by household location to the statement: My local community demonstrates respect for residents of different cultures and belief systems (N=4,615)
Source: NCR-Stat Baseline Survey, 2022
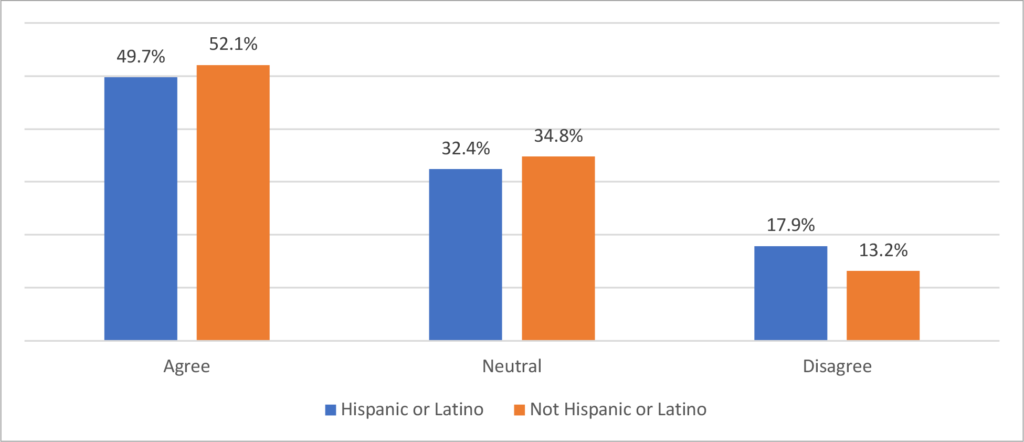
Figure 4 shows the perception of Hispanic or Latino respondents about how their local community treats residents of different cultures and belief systems. This specific group presents the same behavior as seen above, which is a higher share in agreement than disagreement. However, if we take a closer look, they agree and feel neutral to this statement in a lower share than respondents that are not Hispanic or Latino. In fact, the Hispanic or Latino respondents disagree with this statement in a higher percentage than those who don’t belong to this demographic group.
Figure 4. Responses by ethnicity to the statement: My local community demonstrates respect for residents of different cultures and belief systems (N=4,622)
Source: NCR-Stat Baseline Survey, 2022
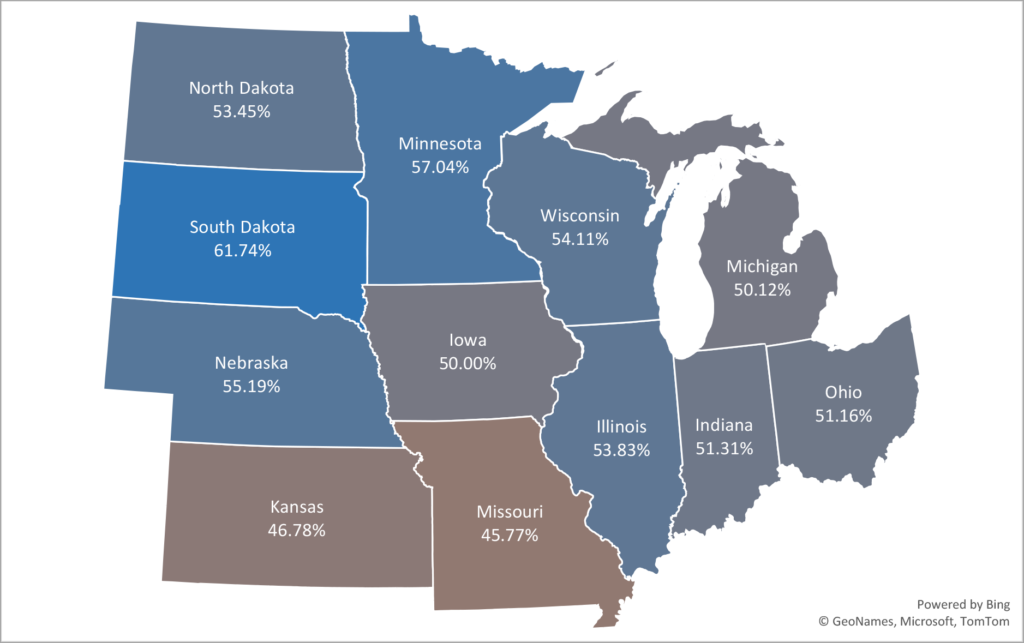
Respondents in the NCR states reported similar shares of agreement about how their local community demonstrates respect for residents of different cultures and belief systems.
Figure 5. Responses by state in agreement with the statement: My local community demonstrates respect for residents of different cultures and belief (N=4,185)
Source: NCR-Stat Baseline Survey, 2022
When it comes to the neutral position of the respondents, it can be noticed that most of the people that stand for this option are in Kansas, whereas the states with fewer people that selected this option live in South Dakota. The northern sates of the region are less neutral in comparison to the states located in the southern part of the region, as it can be seen in the Figure 6. The average of all the States in this region is 52.67%.
The results of the NCR-Stat: Baseline Survey revealed that the perception of respect for residents of different cultures and belief systems can vary based on state, gender, household location, ethnicity, and race. More information about the survey or the data can be found on the NCR-Stat web page.
References
[1] Bednarikova, Z.; Marshall, M. I.; Wiatt, R. D.; Wilcox, Jr, M. D. (2022). North Central Region Household Data (NCR-Stat): Baseline Survey. Purdue University Research Repository. doi:10.4231/2DEM-Z333
[2] Non-Binary respondents were also asked about their opinion regarding the statement. Yet, since the number of respondents was very low, we did not include them in the analysis.
Author
Alejandra Armesto Gómez, Graduate Research Assistant, North Central Regional Center for Rural Development
Download article
Suggested citation
Armesto Gómez, A. (2023, April 25). How Does the North Central Region Perceive Residents from Different Cultures and Belief Systems? North Central Regional Center for Rural Development. https://ncrcrd.ag.purdue.edu/2023/04/25/how-does-the-north-central-region-perceive-residents-from-different-cultures-and-belief-systems/
