By Zuzana Bednarik, Ph.D.
A better understanding of what makes people happy means identifying determinants of happiness. Research on happiness enables policymakers to assess different policy measures in terms of their impacts on happiness and overall well-being.
What is the nature of happiness? Happiness can be understood in different ways. Some experts assume that people are born happy or unhappy. Others consider happiness as a component of personality that forms during a person’s life. Another concept says that happiness is unstable and can change based on inner factors and outside effects. In our analysis, we incline to the opinion that happiness is the sum of two components – a personal one and another component that responds to changes in individual circumstances and different life situations. [1]
In the NCR-Stat: Baseline Survey [2], we asked respondents how happy they felt at the time of the survey. We used a Likert scale to measure self-reported happiness, with 0 representing “extremely unhappy” and 10 as “extremely happy.” The value 5 is considered the midpoint, meaning “neither unhappy nor happy.”
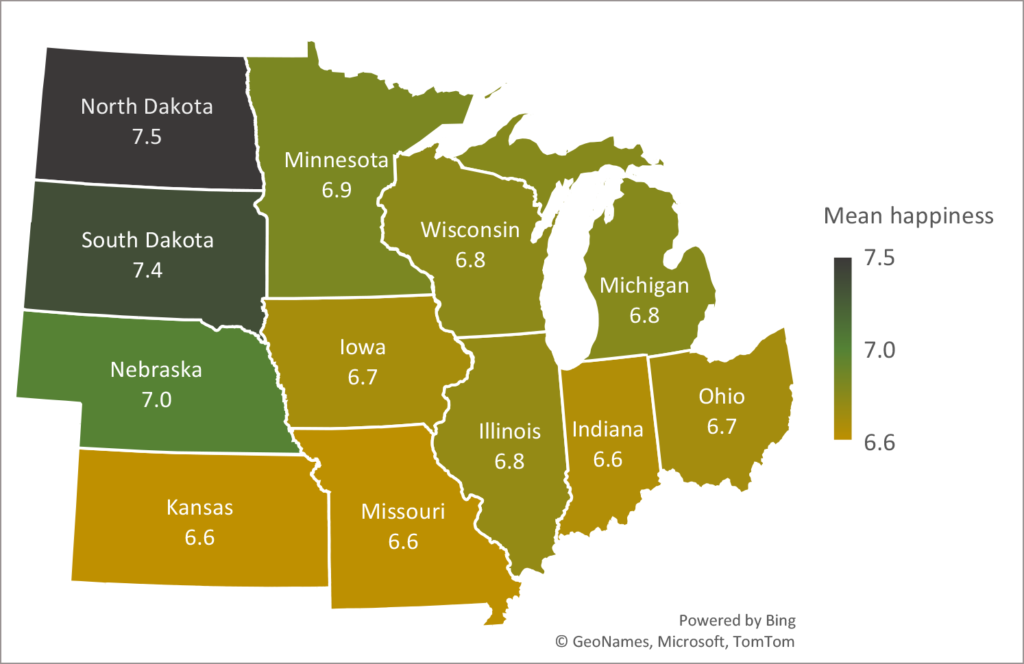
Using these criteria, the overall happiness in the North Central Region (NCR) is 6.8, meaning that respondents are quite happy. Happiness differs by state ranging from 6.6 in Indiana, Missouri, and Kansas to 7.5 in North Dakota (Figure 1).
Figure 1. Mean happiness in the North Central Region by state (N=4,583)
Source: NCR-Stat: Baseline Survey, 2022.
Men are happier than women in the NCR region (7.0 and 6.7, respectively) and in most of the NCR’s states, except Minnesota and Ohio. The biggest difference between men and women is in Nebraska (7.5 for men and 6.8 for women) and North Dakota (7.8 for men and 7.2 for women).
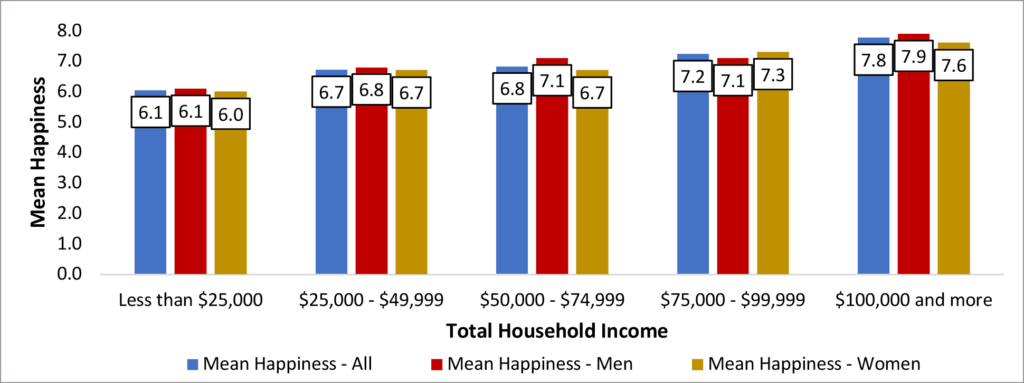
Income has historically been the variable most closely related to happiness. It is evident from Figure 2 that respondents’ happiness increases along with total household income. Respondents with a household income of less than $25,000 are still happy (6.1), but those with a household income of $100,000 and more are much happier (7.8). Women are slightly less happy than men at all income levels except the $75,000-$99,999 income bracket.
Figure 2. Mean happiness in the North Central Region by combined total household income (N=4,583)
Source: NCR-Stat: Baseline Survey, 2022.
The topic of self-reported (subjective) health status and its connection to happiness has been a growing body of research over the last few decades. Unsurprisingly, people reporting poor health are less happy or not happy at all. Nevertheless, these findings are important for an individual’s well-being and policy decisions, as happy people think more positively about their health and life.
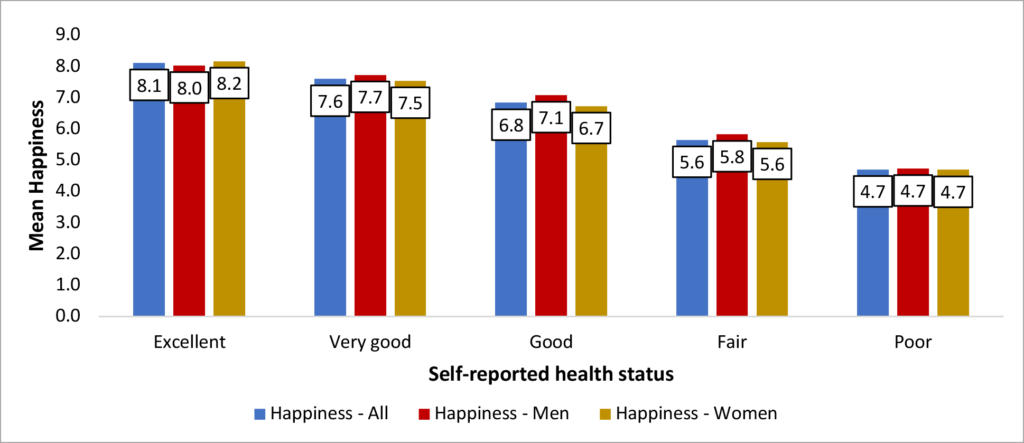
To gain data about the relation between happiness and health in the NCR, we asked respondents about their subjective general health status measured with five categories: excellent, very good, good, fair, and poor. As Figure 3 shows, the trend is obvious. Respondents rating their health as excellent are very happy (8.1), and the happiness of those with poor health is even lower than the midpoint, implying that they are slightly unhappy (4.7). Again, women are less happy in all categories of self-reported health status than men, except those who reported excellent health status.
Figure 3. Mean happiness in the North Central Region by self-reported health in general (N=4,583)
Source: NCR-Stat: Baseline Survey, 2022.
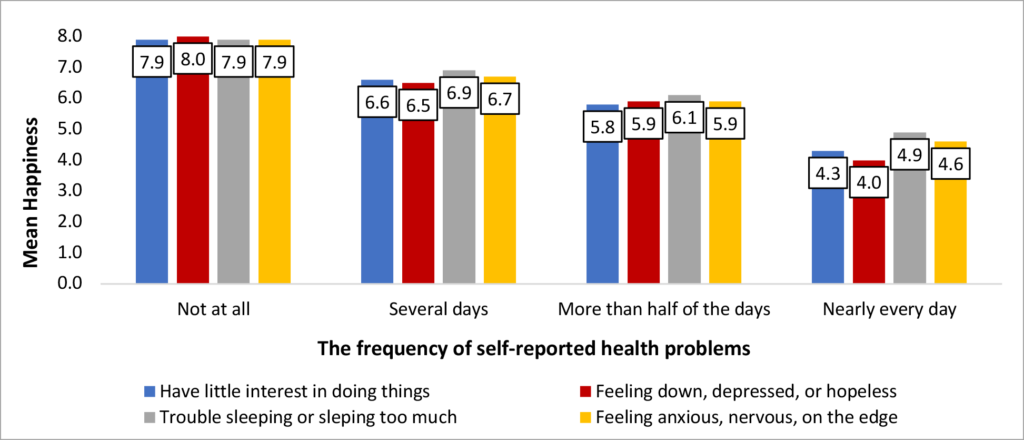
Similar to the positive correlation of self-reported health with happiness, respondents with good self-reported mental health are much happier (the mean happiness is around 7.9) than those who often struggle with mental problems, such as depression, anxiety, and sleep troubles (Figure 4). The mean happiness of respondents that reported feeling down, depressed, or hopeless nearly every day only reached the value of 4.0.
Figure 4. Mean happiness in the North Central Region by self-reported mental health (N=4,583)
Source: NCR-Stat: Baseline Survey, 2022.
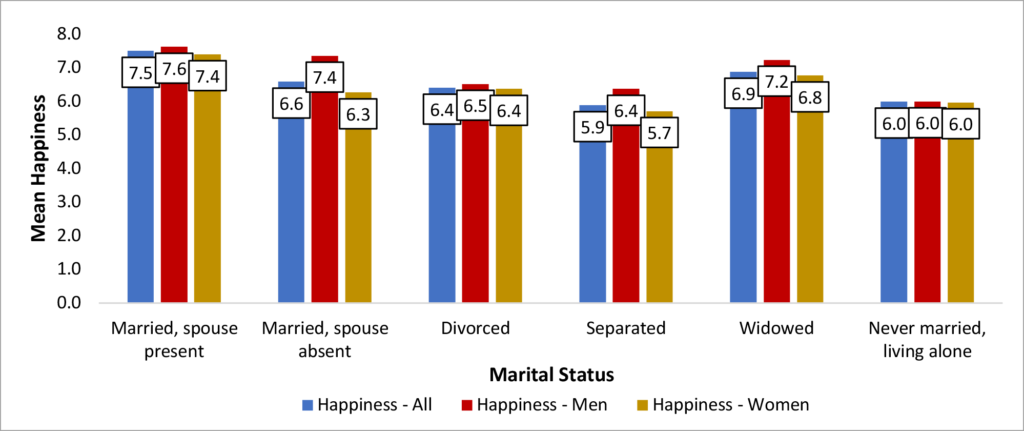
Looking at the effect of marital status, married householders are generally happier than other categories (around 7.5) (Figure 5). Married women with absent spouses and women living separately from their spouses tend to be less happy (6.3 and 5.7, respectively) than married men with spouses absent and men living separately from their spouses (7.4 and 6.4, respectively). Never married, living alone respondents reported lower happiness than other marital status categories.
Figure 5. Mean happiness in the North Central Region by marital status (N=4,583)
Source: NCR-Stat: Baseline Survey, 2022.
Our survey data suggest that different working status does not change reported happiness. The mean happiness of wage-employed and retired respondents reached an identical 6.9. The mean happiness of self-employed and unemployed is a bit lower, with a value of 6.7.
Differences in the mean happiness based on a current residential location, specifically rural and urban, are also negligible. The mean self-reported happiness of urban respondents is 6.8, and for rural respondents is 6.9.
To summarize the results of our analysis, we list the analyzed factors that stand out as possible determinants of happiness and well-being: residential state, gender, total household income, health, and marital status. The following analyzed factors have a negligible or little impact on the mean self-reported happiness of respondents in the NCR: working status and residential location (urban versus rural).
References
[1] More approaches and theories to happiness and well-being can be found in Dowling, J.M. and Chin-Fang, Y. 2007. Modern development in behavioral economics: social science perspectives on choice and decision making. World Scientific Publishing: Singapore.
[2] Bednarikova, Z.; Marshall, M. I.; Wiatt, R. D.; Wilcox, Jr, M. D. (2022). North Central Region Household Data (NCR-Stat): Baseline Survey. Purdue University Research Repository. doi:10.4231/2DEM-Z333
Author
Zuzana Bednarik, Ph.D., Research and Extension Specialist, North Central Regional Center for Rural Development
Download article
Suggested citation
Bednarik, Z. (2023, April 17). How Happy Are People in the North Central Region? North Central Regional Center for Rural Development. https://ncrcrd.ag.purdue.edu/2023/04/17/how-happy-are-people-in-the-north-central-region/
