By Zuzana Bednarik, Ph.D. and Renee D. Wiatt
This article provides information from the North Central Region Household Data (NCR-Stat): Baseline Survey about respondents that reported problems paying medical bills in the last 12 months. [1] We looked closer at the demographic characteristics, household income, working status, health status, insurance coverage, and location of the respondents to explore who experienced problems paying medical bills.
Twenty-two percent of respondents who participated in the survey reported problems paying medical bills in the last 12 months. This result is similar to the outcomes of the Survey of Income and Program Participation (SIPP) conducted by the U.S. Census Bureau, showing that 19% of U.S. households could not afford to pay for medical care before or right after receiving the care.
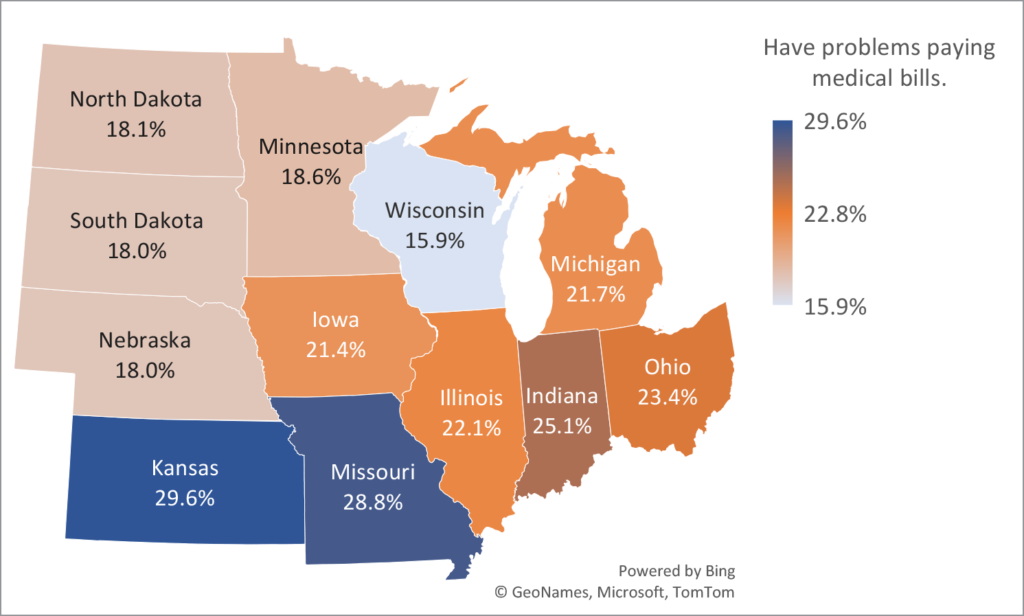
Based on NCR-Stat data, the states with the highest shares of respondents that reported having problems paying medical bills were Kansas (29.6%) and Missouri (28.8%). Conversely, respondents in Wisconsin showed the lowest rate of 15.9% (Figure 1).
Figure 1. The share of respondents with problems paying medical bills in the last 12 months in the North Central Region by state (N=4,579)
Source: NCR-Stat Baseline Survey, 2022
Survey results revealed only a slight difference between urban and rural areas. Nearly twenty-two percent (21.7%) of urban respondents indicated problems with medical bill payments compared to 23.4% in rural areas of the North Central Region (NCR).
Problems paying medical bills by insurance coverage and health status
Respondents without health coverage showed a higher share of those having trouble paying their medical bills (34.7%) compared to insured respondents (21%). These results also suggest that health insurance and health coverage plans only partially prevent people from carrying medical debt, and even insured people may have problems paying medical bills.
It is not surprising that respondents that reported fair or poor health status have more problems paying medical bills (30.5% and 35.7%, respectively) than those with excellent, very good, or good health (on average, 19.2%) (Figure 2). According to the U.S. Census Bureau, medical care for people with worse health can be more expensive, which may lead to carrying medical debts.[2]
Figure 2. The share of respondents with problems paying medical bills in the last 12 months in the North Central Region by health status

Source: NCR-Stat Baseline Survey, 2022
Problems paying medical bills by income level and working status
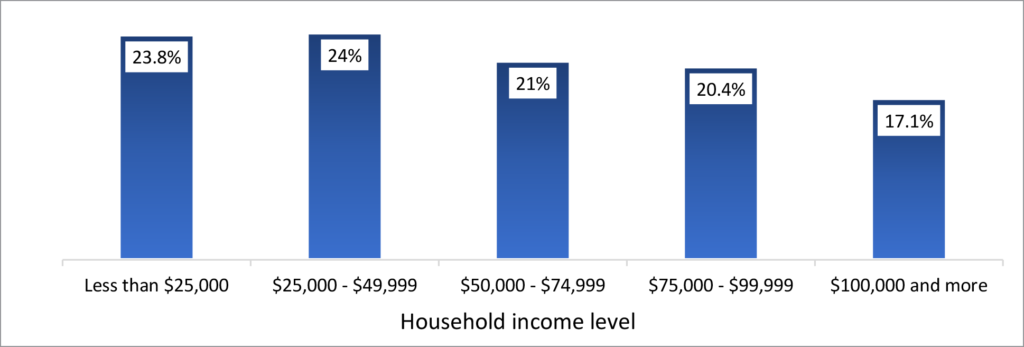
Income level might also be linked to the ability to pay medical bills. Households with a household income of less than $50,000 per year are more likely to carry their unpaid medical bills (24%) than those with household incomes over $100,000 per year (17%) (Figure 3).
Figure 3. The share of respondents with problems paying medical bills in the last 12 months in the North Central Region by household income level
Source: NCR-Stat Baseline Survey, 2022
The NCR-Stat data shows that the share of respondents who have problems paying household medical bills has minimal variance among three categories: wage employed, self-employed, and unemployed (Figure 4), and ranges between 24% and 26%. A significantly smaller share of the retired population in the NCR had issues paying medical bills, with only 13% and 14% of rural and urban respondents reporting this problem, respectively.
Figure 4. The share of respondents with problems paying medical bills in the last 12 months in the North Central Region by employment type

Source: NCR-Stat Baseline Survey, 2022
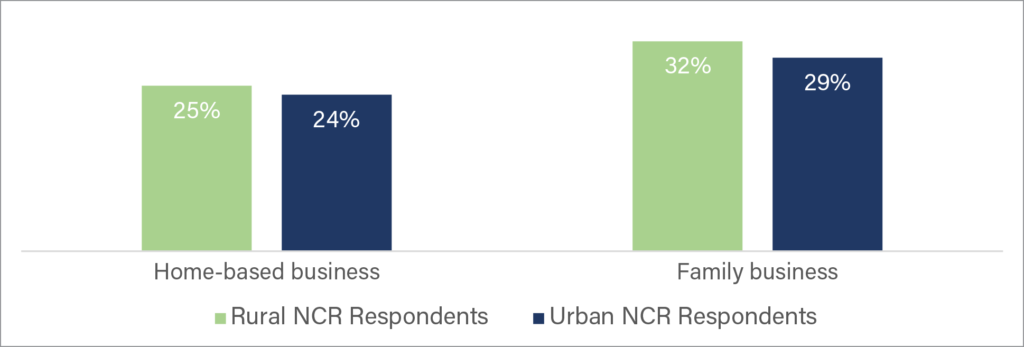
Analysis of home-based and family businesses showed more variation in results (Figure 5). Twenty-five percent of rural home-based business owners and 24% of urban home-based business owners had problems paying medical bills. Family business owners reported higher rates of difficulty paying medical bills, with 32% of rural respondents and 29% of urban respondents having issues.
Figure 5. The share of respondents with problems paying medical bills in the last 12 months in the North Central Region by location and business type
Source: NCR-Stat Baseline Survey, 2022
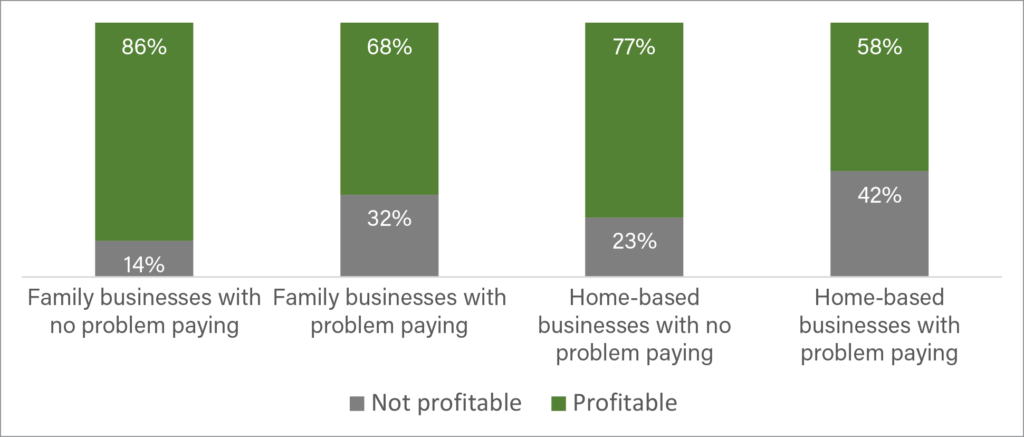
Business profit was compared among family and home-based businesses to determine if trends emerged with those owners who did and did not report issues paying medical bills (Figure 6). Among family business owners without problems paying medical bills, only 14% of businesses were not profitable. A higher rate of family businesses (32%) who had problems paying medical bills were not profitable.
Similar trends to family businesses with problems paying medical bills were found among home-based businesses with problems paying medical bills. Of the home-based businesses without problems paying medical bills, roughly 23% were not profitable, and 77% were profitable. Around 42% of home-based businesses with problems paying medical bills were not profitable.
Figure 6. Home-based and family businesses by profitability: share of owners with and without problems paying medical bills in the last 12 months in the North Central Region
Source: NCR-Stat Baseline Survey, 2022
Problems paying medical bills by demographic characteristics
Twenty-three percent of family households have problems with payments of medical bills compared to 19% of non-family households (Figure 7).
Figure 7. The share of respondents with problems paying medical bills in the last 12 months in the North Central Region by the type of household

Note: N=4,564 for family and non-family household types. N=4,579 for households with or without children living in the household.
Source: NCR-Stat Baseline Survey, 2022
Almost one-third (31%) of households with children under the age of 25 that live in the household reported problems paying medical bills than those without children living in the household (18%).
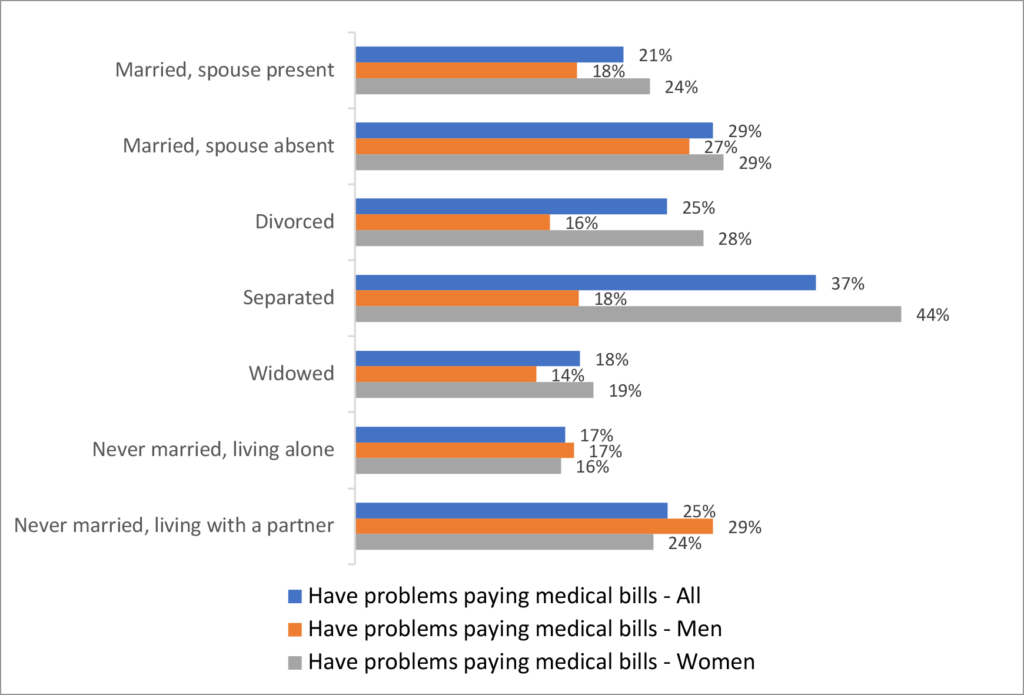
If we drill down further, we see that marital status and gender may play a role in the ability of a householder to pay medical bills. Never married, living alone, and widowed householders have the lowest share of those who cannot pay medical bills (17% and 18%, respectively) (Figure 8). Women who are separated or divorced are significantly more likely to have trouble paying their medical bills than their male counterparts. Forty-four percent of female respondents living separately report having problems paying medical bills. Even in married households, a higher share of women than men have problems with medical bills payments.
Figure 8. The share of respondents with problems paying medical bills in the last 12 months in the North Central Region by marital status and gender
Source: NCR-Stat Baseline Survey, 2022
Another aspect linked to the ability to pay medical bills is age. More householders between the ages of 18 and 64 than older respondents reported problems with medical bill payments, with a peak between 25-44 years old (Figure 9). Respondents 65 years old and older should be covered by Medicare health plans which likely helps most of them avoid problems paying their medical bills.[3]
Figure 9. The share of respondents with problems paying medical bills in the last 12 months in the North Central Region by age groups

Source: NCR-Stat Baseline Survey, 2022
Figure 10 presents racial and ethnic disparities in paying medical bills. Nearly one-third (28.9%) of Hispanic or Latino respondents, followed by American Indian/Alaska Native (27%) respondents, had problems paying their medical bills in the last 12 months. Asian respondents have the lowest share of those carrying medical debts (12.4%).[4]
Figure 10. The share of respondents with problems paying medical bills in the last 12 months in the North Central Region by race and ethnicity

Note: AIAN = American Indian or Alaska Native, AA = African American
Source: NCR-Stat Baseline Survey, 2022
Summary
The results of the NCR-Stat: Baseline Survey revealed that problems paying medical bills vary across location, demographic characteristics, socioeconomic status, insurance coverage, and health status. Respondents in the following categories are more likely to report troubles with the payment of their medical bills:
- family households with children under the age of 25,
- women living separately,
- young people between the ages of 25 and 44,
- respondents representing Hispanic or Latino ethnicity and American Indian or Alaska Native race, lower-income families,
- family business owners and owners of non-profitable businesses,
- uninsured respondents and respondents with worse health.
References
[1] Bednarikova, Z.; Marshall, M. I.; Wiatt, R. D.; Wilcox, Jr, M. D. (2022). North Central Region Household Data (NCR-Stat): Baseline Survey. Purdue University Research Repository. doi:10.4231/2DEM-Z333
[2] U.S. Census Bureau: https://www.census.gov/library/stories/2021/04/who-had-medical-debt-in-united-states.html
[3] U.S. Census Bureau: https://www.census.gov/library/stories/2021/04/who-had-medical-debt-in-united-states.html
[4] For more information about percentages of people living in families that have problems paying medical bills, see https://www.cdc.gov/nchs/data/databriefs/db357-h.pdf
Authors
Zuzana Bednarikova, Ph.D. and Renee D. Wiatt, Research and Extension Specialists, North Central Regional Center for Rural Development
Download article
Suggested citation
Bednarik, Z. and Wiatt, R. D. (2023, January 12). Who Cannot Afford to Pay Medical Bills in the North Central Region? North Central Regional Center for Rural Development. https://ncrcrd.ag.purdue.edu/2023/01/12/who-cannot-afford-to-pay-medical-bills-in-the-north-central-region/
