By Zuzana Bednarik, Ph.D.
In the 2022 NCR-Stat Baseline Survey, the NCRCRD examined the current general health status of households across the North Central Region (NCR). [1] Heads of households were asked to rate their health on a scale of excellent, very good, good, fair, or poor. Most respondents reported their health as good (37%) and very good (27%). Nearly 11% of respondents considered their health excellent, 20% fair, and 6% poor.

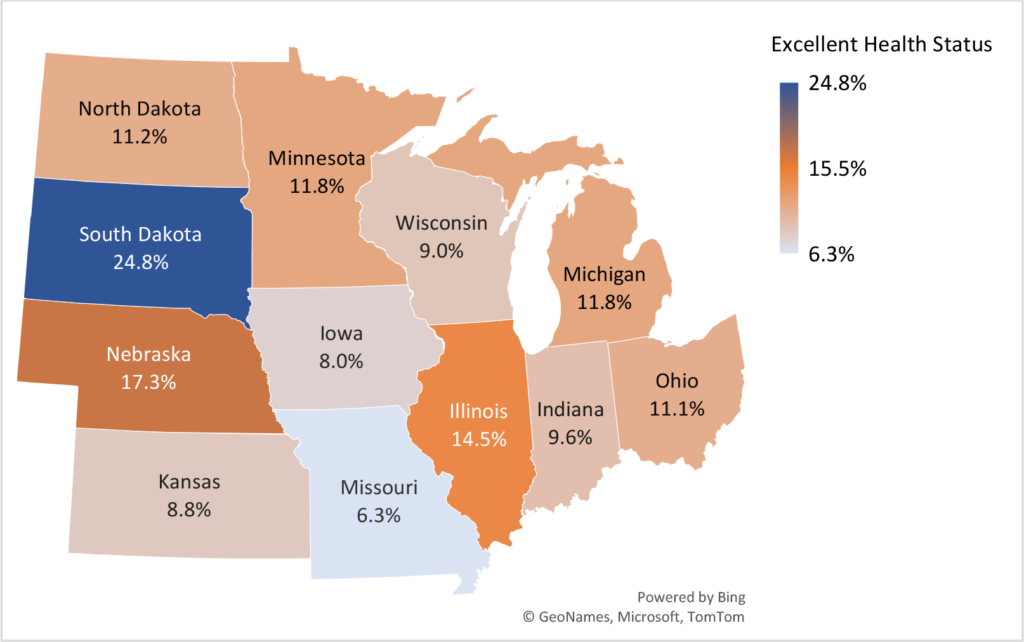
A closer look at the state level revealed that many reported results are similar to the regional level. Most respondents indicated their health as good or very good; however, there are also apparent differences between the states. Nearly 25% of respondents in South Dakota rated their health as excellent. In contrast, the lowest shares of respondents with excellent health were in Missouri (6%) and Iowa (8%) (Figure 1)
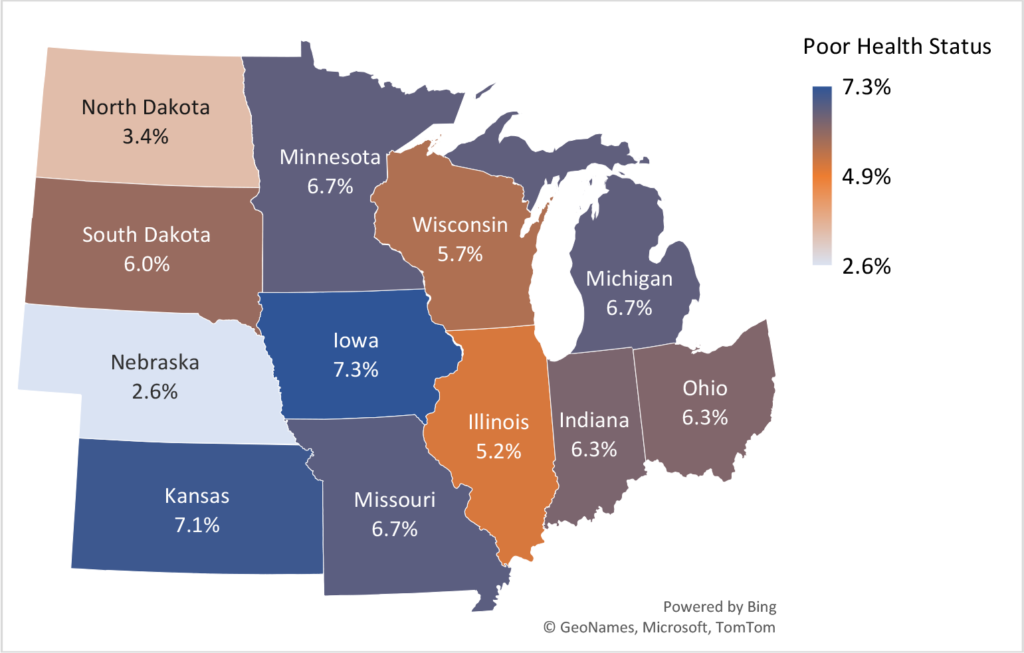
The share of respondents that rated their health as good ranges from the lowest in South Dakota (31%) to the highest in Missouri (41%). Indiana, Iowa, and Kansas had the highest fair and poor health ratings. In contrast, respondents from Nebraska, North Dakota, and South Dakota show the lowest shares of fair and poor health (Figure 2).
Figure 1. Health rated as excellent in the North Central Region by state (N=4,651)
Source: NCR-Stat Baseline Survey, 2022
Figure 2. Health rated as poor in the North Central Region by state (N=4,651)
Source: NCR-Stat Baseline Survey, 2022
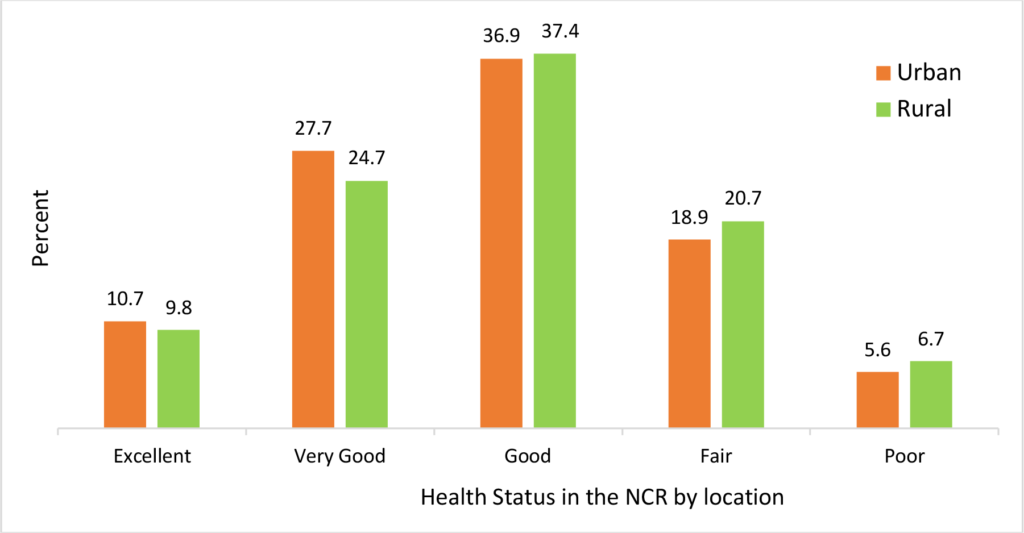
Respondents living in rural areas reported a slightly higher share of fair and poor health than respondents from urban areas (Figure 3). The differences may point out health-related challenges that rural areas face, including higher poverty rates, a lower median income, an aging population, limited healthcare and broadband infrastructure, and rising rates of prescription medication abuse.[2]
Figure 3. Health status in the North Central Region by location (N=4,668)
Source: NCR-Stat Baseline Survey, 2022
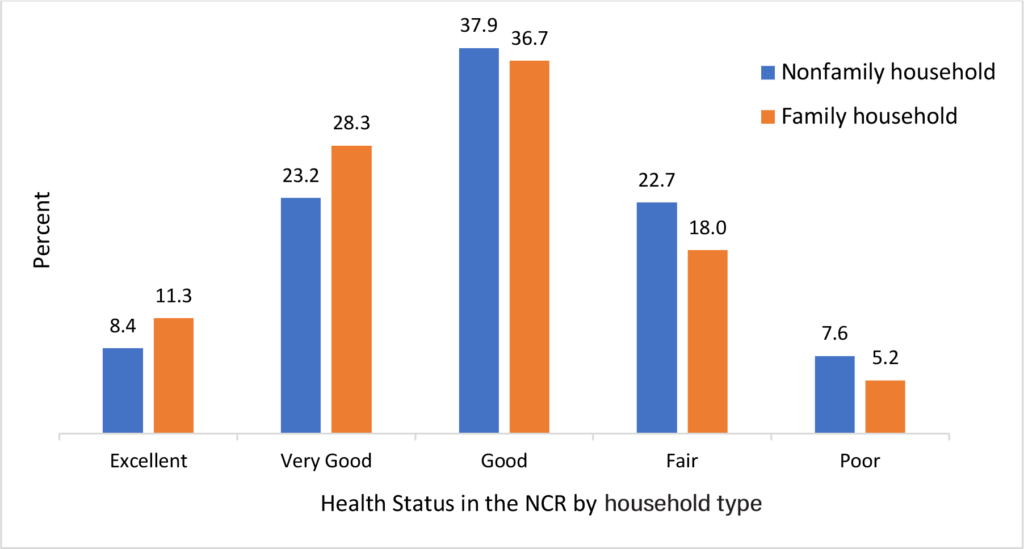
Health status in the NCR differs between nonfamily and family households. Family households generally reported better health status than nonfamily households (Figure 4). The age structure of the family and nonfamily households revealed that the share of nonfamily households with a householder older than 55 years is 11% higher than in family households. Moreover, the number of divorced and widowed householders in our survey grew along with age. As nonfamily households also include widowed and divorced householders living alone or with nonrelatives, the age structure and marital status may have implications for a householder’s general health status.[3]
Figure 4. Health status in the North Central Region by household type (N=4,668)
Source: NCR-Stat Baseline Survey, 2022
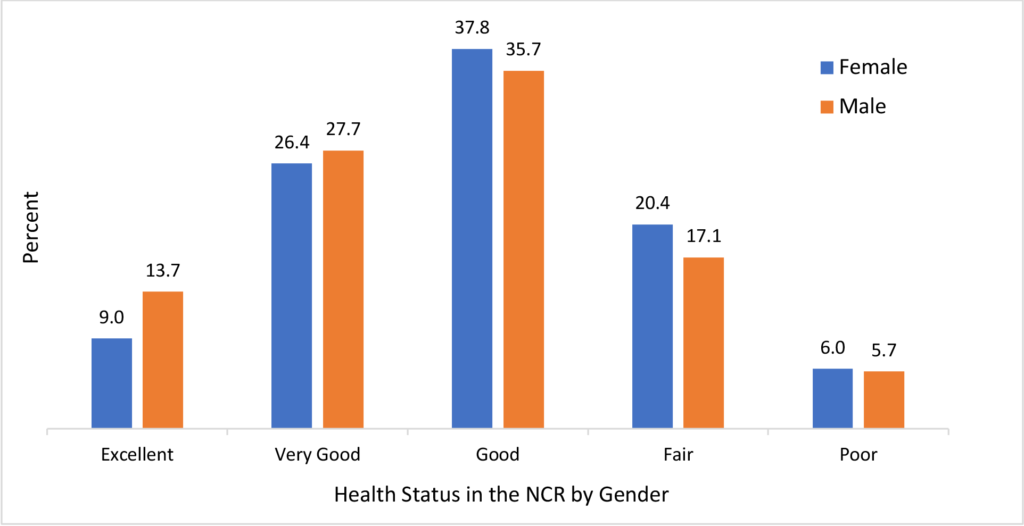
Figure 5 shows the statistically significant differences between the self-reported health status of men and women. The share of female respondents indicating excellent and very good health status is lower than men. Yet, the percentage of women with good and fair health is higher by 2.1% and 3.3%, respectively. The only category women and men rated almost the same was poor health status. The findings are consistent with evidence from various household surveys. Women regularly report worse self-rated health resulting from a combination of societal, biological, and health factors that contribute to the differences in self-reported health between women and men.[4],[5],[6]
Figure 5. Health status in the North Central Region by gender (N=4,668)
Source: NCR-Stat Baseline Survey, 2022
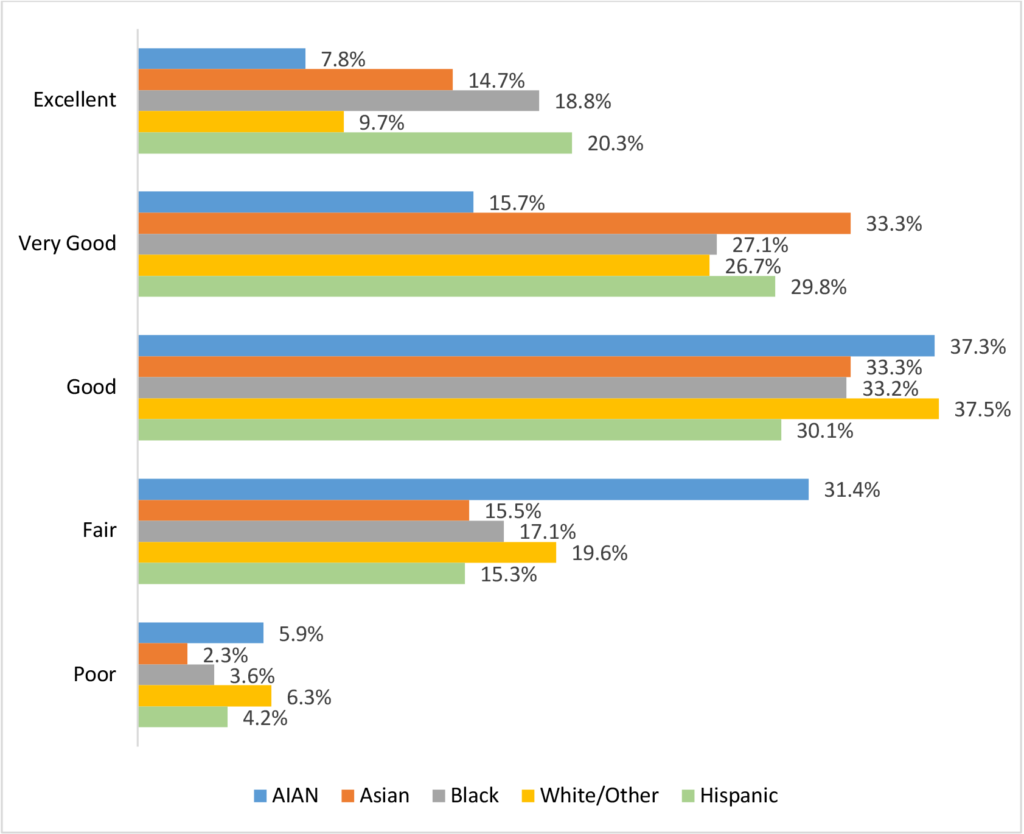
Figure 6. Health status in the North Central Region by race and Hispanic origin (N=4,668)
Source: NCR-Stat Baseline Survey, 2022
Figure 6 illustrates that responses regarding general health status vary across racial and ethnic groups. Fifty percent of Hispanic respondents reported excellent or very good health status, followed by Asian (48%) and Black (46%) respondents. In contrast, American Indians and Alaska Natives (AIAN) represent the group with the lowest share of respondents indicating excellent or very good status (24%) and the highest percentage of respondents with fair or poor health (37%). The White/Other householders have the second highest share of fair or poor health (26%).
References
[1] Bednarikova, Z.; Marshall, M. I.; Wiatt, R. D.; Wilcox, Jr, M. D. (2022). North Central Region Household Data (NCR-Stat): Baseline Survey. Purdue University Research Repository. doi:10.4231/2DEM-Z333
[2] Rural America At A Glance. 2017 Edition. USDA, Economic Research Service, 2017. https://www.ers.usda.gov/webdocs/publications/85740/eib-182.pdf?v=1613.6
[3] Robards J., Evandrou M., Falkingham J., and Vlachantoni A. 2012. doi: 10.1016/j.maturitas.2012.08.007
[4] BMC Public Health: https://bmcpublichealth.biomedcentral.com/articles/10.1186/s12889-016-3352-y
[5] Harvard Health Publishing: https://www.health.harvard.edu/newsletter_article/mars-vs-venus-the-gender-gap-in-health
[6] Scientific American: https://www.scientificamerican.com/article/why-women-report-being-in/#:~:text=When%20asked%20to%20rate%20their,is%20simply%20a%20reporting%20bias
Author
Zuzana Bednarik, Ph.D., Research and Extension Specialist, North Central Regional Center for Rural Development
Download article
Suggested citation
Bednarik, Z. (2022, September 18). NCR-Stat: Household Health Status in the North Central Region. North Central Regional Center for Rural Development. https://ncrcrd.ag.purdue.edu/2022/09/19/household-health-status-in-the-north-central-regio/
