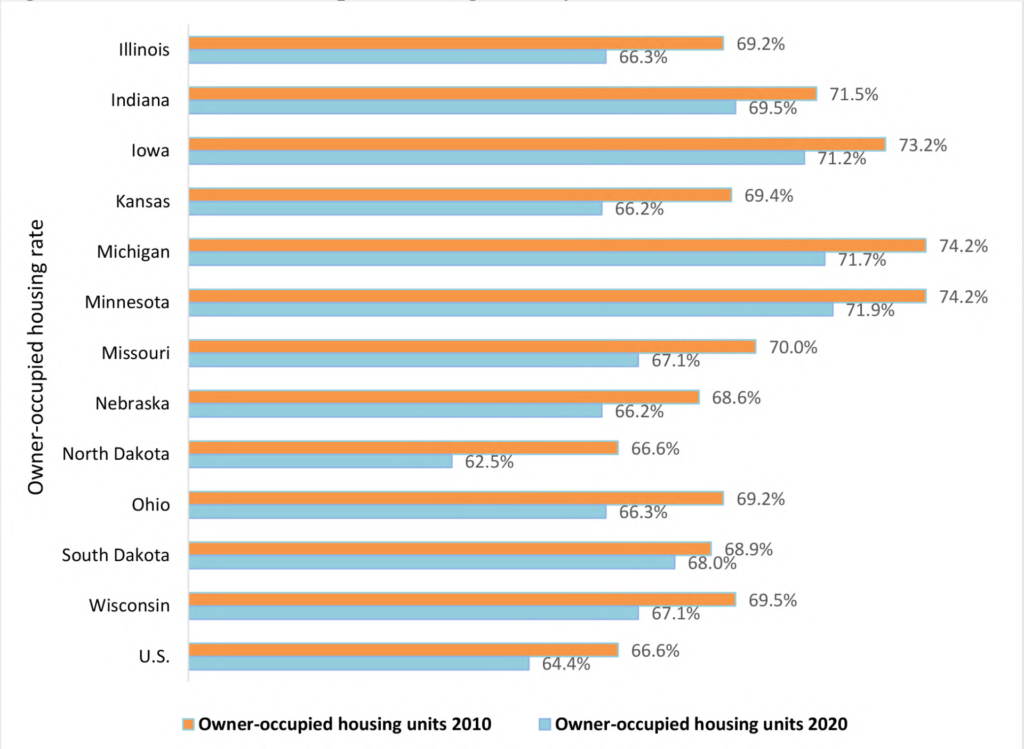
Home ownership has traditionally been a perception of prosperity and financial security in the United States. However, the share of owner-occupied housing units in the North Central Region (NCR) has constantly been decreasing since the last decennial census in 2010, following the national trend. The NCR’s current owner-occupied housing tenure rate is still around two-thirds of the population but is lower on average by 2.5% compared to 2010. The highest drop in home ownership between 2010 and 2020 was reported in North Dakota (4.1%) and Kansas (3.2%). The slightest difference was found in South Dakota (0.9%) (Figure 1).
Figure 1. Share of owner-occupied housing units by NCR state in 2010 and 2020

Source: U.S. Census Bureau: 2006-2010 and 2016-2020 American Community Surveys 5-Year Estimates
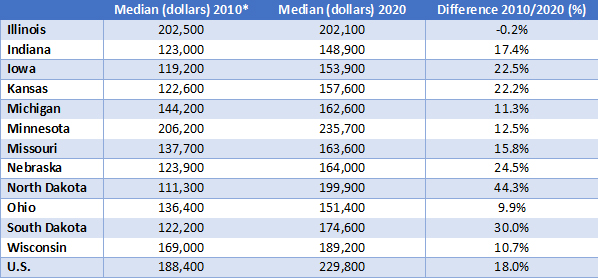
Rising housing prices discourage most first-time buyers and force them to move away from homeownership. The prices in NCR increased on average by 18.4% between 2010 and 2020, with significant differences between states. Table 1 shows that North Dakota experienced the highest median price increase (by 44.3%), followed by South Dakota (30%) and Nebraska (24.5%). The only state with a reverse trend is Illinois, where median home prices remained nearly the same.
Table 1. Values of owner-occupied housing units by NCR state in 2010 and 2020

Source: U.S. Census Bureau: 2006-2010 and 2016-2020 American Community Surveys 5-Year Estimates
*Note: 2010 prices are adjusted for inflation by a cumulative price increase of 34.5%, according to the Bureau of Labor Statistics consumer price.
Higher real estate prices significantly changed the house value’s portfolio. While the share of housing in NCR with a value of less than $50,000 decreased between 2010 and 2020 on average by 2.7%, the housing valued from $300,000 to $499,999 increased by 5.9%. In contradiction to Illinois, where the housing prices just slightly changed, states such as North Dakota, South Dakota, and Nebraska faced a drop in lower value housing (less than $50,000) by 10.3%, 6.5%, and 4.3%, respectively. The shrinking share of low-cost homes mirrored the growth of more expensive homes. In North Dakota, housing with a value of $200,000 to $299,999 increased by 15.1%, and the share of housing from $300,000 to $499,999 raised by 13.6%.[1]
The most striking changes in the rate and value of owner-occupied housing units may also be linked to the population changes in NCR. Illinois is the largest and only state in the NCR to have faced a population decline (due to domestic outmigration) of 0.1% between 2010 and 2020 and thus experienced a decrease in demand for housing. In contrast, North Dakota gained 15.8% more population compared to 2010, South Dakota 8.9%, and Nebraska 7.4%.[2] All three states gained their population through natural growth when the young American Indian population significantly contributed to this growth. The oil boom in North Dakota in the early 2010s attracted thousands of workers to the western part of the state. Oil workers moved to oil-rich counties from elsewhere, explaining net domestic migration in the state.[3] Population gain leads to a growing demand for housing and higher housing prices that many people cannot afford.
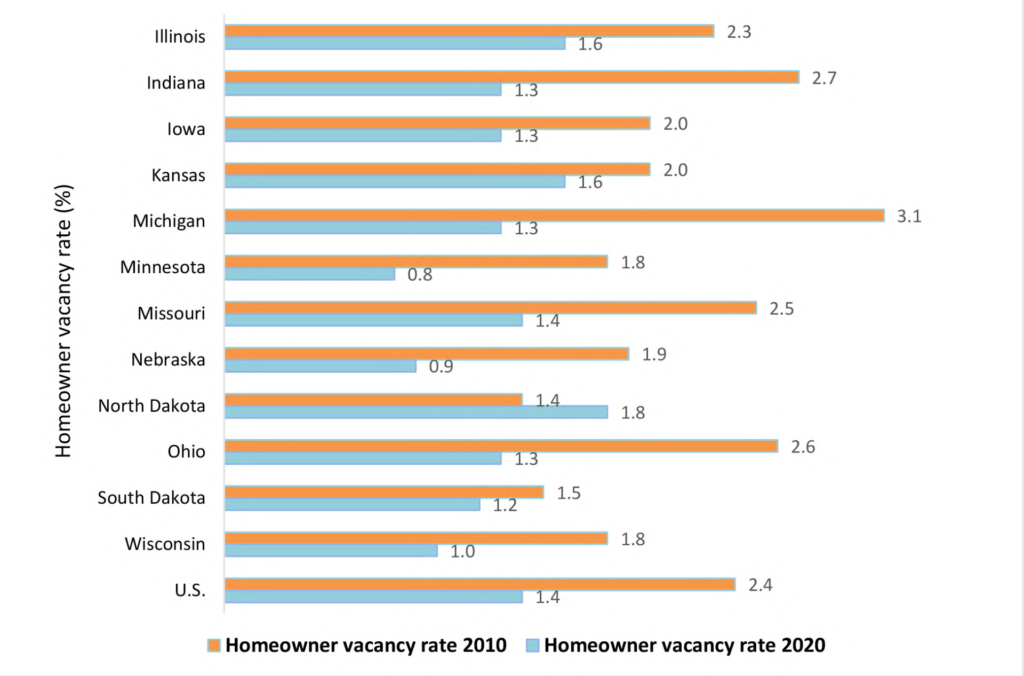
According to the U.S. Census Bureau data, the vacancy rate for homeowner housing (the proportion of the vacant homeowner inventory for sale) has been the lowest since 1980.[4] The average homeowner vacancy rate in NCR in 2020 was 1.3%. This rate was 0.7% lower than in 2010. The homeowner vacancy rate dropped in all NCR states except North Dakota, where the rate increased by 0.4% (Figure 2), most likely due to high housing prices. The most significant decline in this rate was in Michigan (1.8%) and Indiana (1.4%).
Figure 2. Homeowner vacancy rate by NCR state in 2010 and 2020

Source: U.S. Census Bureau: 2006-2010 and 2016-2020 American Community Surveys 5-Year Estimates
Two main aspects added to the historical decline in the homeowner vacancy rate. First, the vacancy rate decreased between 2010 and 2020 because the nation was recovering from the foreclosure crisis. Second, the housing market has become very tight during the COVID-19 pandemic indicating deficient housing availability.[5] It is unclear what happens next as rising housing prices and mortgage interest rates contributed to housing challenges across the nation and NCR, especially for low- and moderate-income households, young families, and many Black and Latino or Hispanic families.[6]
———
[1] U.S. Census Bureau: 2006-2010 and 2016-2020 American Community Surveys 5-Year Estimates
[2] U.S. Census Bureau: 2006-2010 and 2016-2020 American Community Surveys 5-Year Estimates
[3] Baumgarten, A. (2020). With a boost from oil, North Dakota’s population growth was among top 10 in 2010s. The Dickinson Press and Forum Communications Company, https://www.thedickinsonpress.com/news/government-and-politics/5034168-With-a-boost-from-oil-North-Dakotas-population-growth-was-among-top-10-in-2010s
[4] The U.S. Census Bureau. https://www.census.gov/library/stories/2022/05/housing-vacancy-rates-near-historic-lows.html?utm_campaign=20220512msacos1ccstors&utm_medium=email&utm_source=govdelivery
[5] The U.S. Census Bureau. https://www.census.gov/library/stories/2022/05/housing-vacancy-rates-near-historic-lows.html?utm_campaign=20220512msacos1ccstors&utm_medium=email&utm_source=govdelivery
Author: Zuzana Bednarikova, zbednari@purdue.edu
Dr. Zuzana Bednarikova is a Research and Extension Specialist at NCRCRD
