
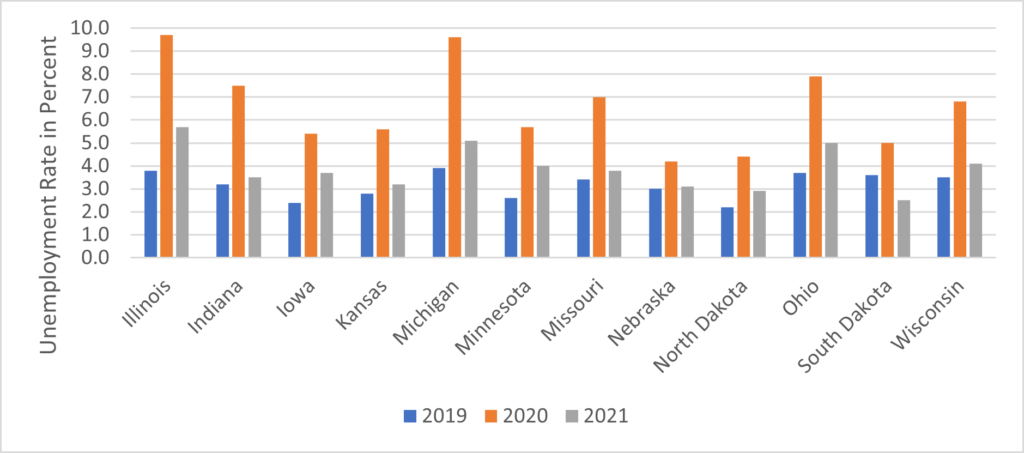
In this article, we explore the impacts of COVID-19 on women’s unemployment rates from different perspectives across the North Central Region (NCR), including women who maintain families, married women, women of different age categories, and racial disparities. The presented data result from the statistics on the employment status of the civilian noninstitutional population[1] provided by the U.S. Bureau of Labor Statistics (BLS).Figure 1 shows the significant increase in women’s unemployment rate across all NCR states in 2020. In contrast to other recessions that affected more male-dominated industries such as manufacturing and construction, the COVID-19 recession hit the service sectors harder, such as restaurants, retail, hospitality, and personal care, which tend to be dominated by women.[2] The highest growth in the unemployment rate occurred in Illinois (from 3.8% in 2019 to 9.7% in 2020) and Michigan (from 3.9% in 2019 to 9.6% in 2020), the two states with a high share of tourism and related services.
The slow recovery from the pandemic recession was obvious in 2021 when all NCR states experienced a decrease in women’s unemployment rate. Although all states, except South Dakota, have not reached their pre-pandemic rates of women’s unemployment, the job gains were noticeable, especially in professional and business services.[3]
Figure 1. Women’s Unemployment Rate in the North Central Region, 2019 – 2021
Source: U.S. Bureau of Labor Statistics
Unemployment of women who maintain families
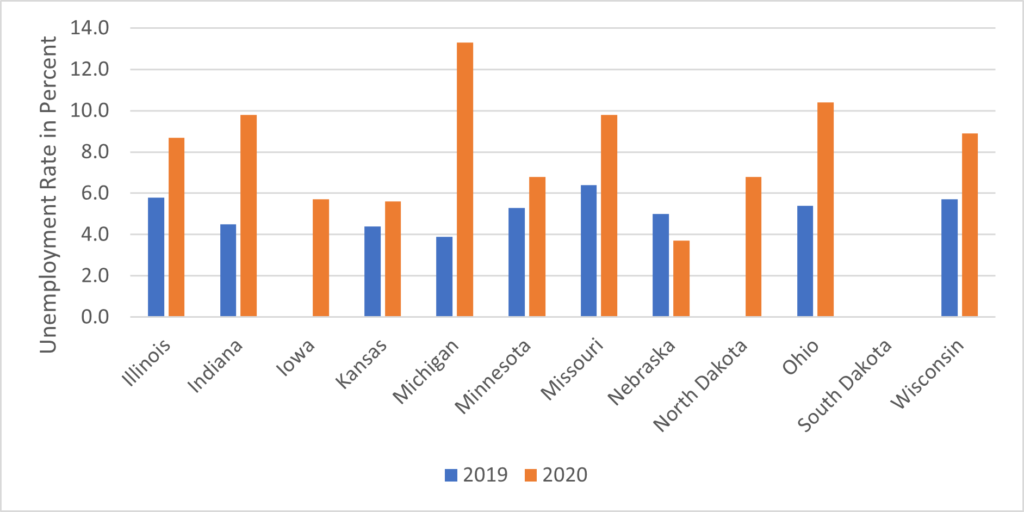
A striking increase in the unemployment rate in 2020 was observed amongst women who maintained families[4] (Figure 2). Even though data are not available for 2021 and some NCR states for 2019 and 2020, Figure 2 demonstrates the negative impact of the pandemic in 2020. Michigan’s unemployment rate was 13.3%, while Ohio’s was 10.4%, and Indiana and Missouri had a 9.8% unemployment rate.
Figure 2. Unemployment of women who maintain families in the North Central Region, 2019 and 2020
Source: U.S. Bureau of Labor Statistics
There are many factors behind the loss of women with children in the labor force. Nevertheless, the most significant factor involves closures of child care facilities pushing mothers to leave their jobs in order to take care of their children. Other issues also contributed to the lower participation of these women in the labor force. In 2020, it was mainly limited in-person school attendance and the need for a parent to stay at home with a child or children. In 2021, it was a return to in-person school instruction, a requirement for labor force reentry, and a lack of childcare facilities.
Women’s unemployment by race
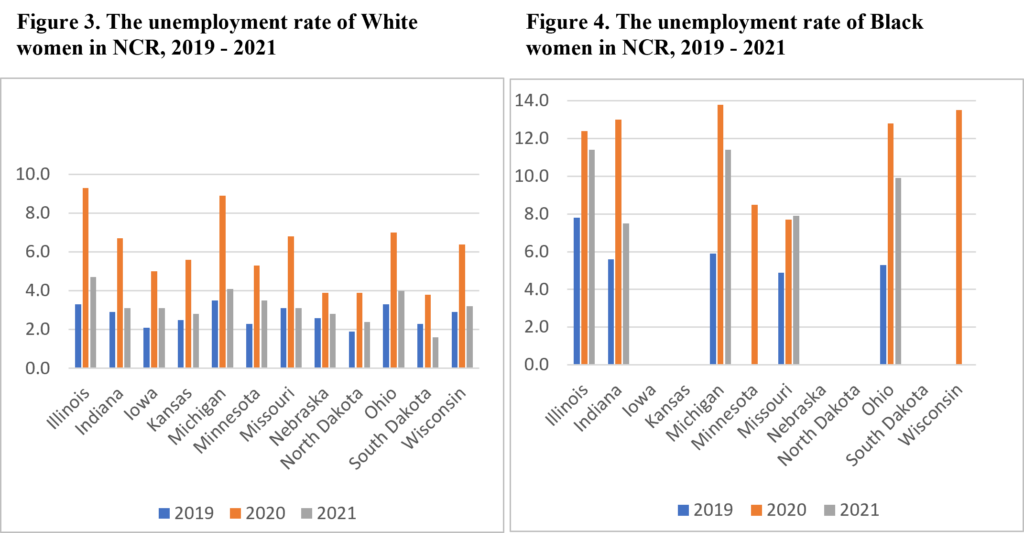
Data in Figure 3 and Figure 4 show the unemployment rate of White and Black women in 2019 – 2021. Again, BLS does not provide data on unemployment rates for all NCR states by race and gender. Still, available data reveal disparities between Black and White women throughout the three-year period. Black women saw a higher unemployment rate in all three years, at least in the NCR states that reported their data.
Source: U.S. Bureau of Labor Statistics
A report published by Brookings points out that the high number of Black women exiting the labor market is unique amongst racial and ethnic groups and can be driven in particular by constant disruptions to child care. Many, mainly small, communities suffer from the closure of child care facilities and a considerable shortage of employees in child care centers.[5]
Women’s unemployment by age group
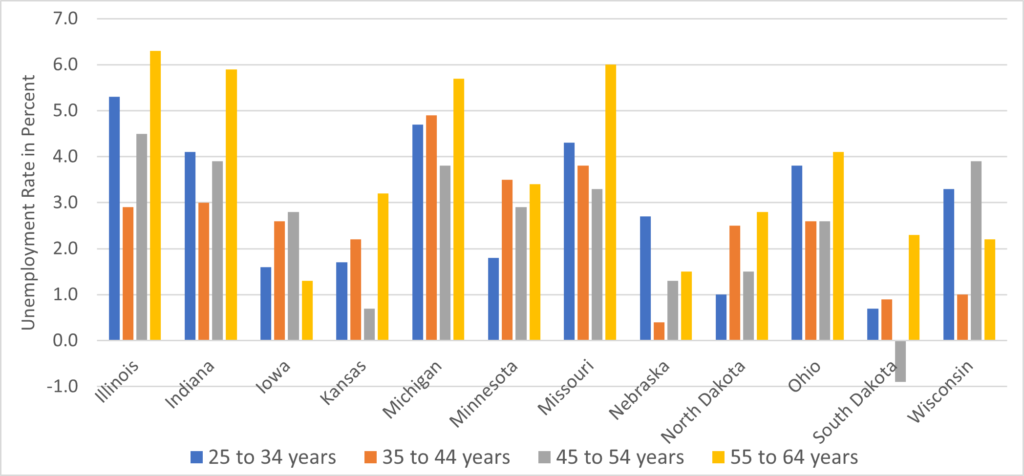
Looking at the age categories of unemployed women, we can see that the unemployment rate increased in all NCR states except one category in North Dakota. Also, there are significant differences between age groups among NCR states. For example, in most NCR states, women between 55 and 64 years old experienced the highest increase in the unemployment rate – in Illinois by 6.3%, Missouri by 6%, Indiana by 5.9%, and Michigan by 5.7% (Figure 5). The second most impacted category is represented by women between 25 and 34 years old.
Figure 5. Change in the unemployment rate of women by age categories in NCR, 2019 and 2020
Source: U.S. Bureau of Labor Statistics
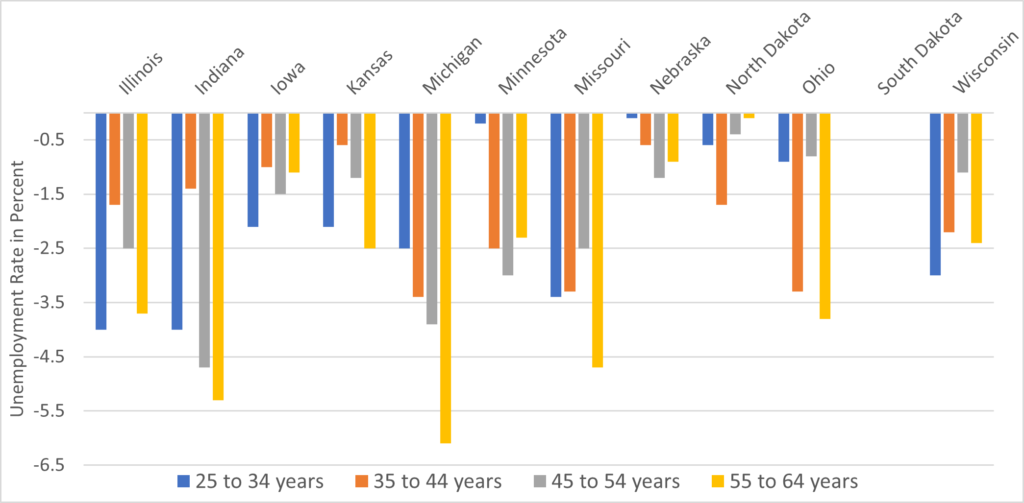
The situation in the women’s labor market improved in 2021. Figure 6 shows that the unemployment rate dropped in all NCR states, especially for women between 55 and 64 years old and between 25 and 34 years old. Women’s age groups 35 – 44 and 45 – 54 years old were more stable in terms of the unemployment rate during the pandemic. Nevertheless, it is important to emphasize that the unemployment rate of women aged 24 – 44 was higher in 2019 than in other age categories, especially in Illinois, Indiana, Ohio, Wisconsin, and South Dakota.
Figure 6. Change in the unemployment rate of women by age categories in NCR, 2020 and 2021
Source: U.S. Bureau of Labor Statistics
Data show that women between 24-44 years old already had a lower labor force participation rate before the pandemic. This suggests that school closures during a pandemic and lack of child care may not be the only reasons why these women did not participate in the job market. In 2021, many women returned to the labor force as school started with in-person education and numerous child care centers reopened. However, the women’s unemployment rate remained lower in 2021 compared to 2019. That said, other factors seem to be at play. Many child care facilities, especially in small communities, stayed closed. Other reasons include the decision of women, especially mothers of young children, to stay at home and postpone their return to work. This may be particularly true pre-and-post pandemic as child care may not be cost-effective for many households. Moreover, employers may be reluctant to employ people with a gap in their work history and/or women’s ties to the work environment weakened in some cases.
________
[1] The U.S. Bureau of Labor statistics defines civilian noninstitutional population as people ages 15 or 16 and older residing in the 50 States and the District of Columbia who do not live in institutions (e.g., penal institutions, mental facilities, homes of the aged), and who are not on active duty in the Armed Forces. https://www.bls.gov/bls/glossary.htm#C
[2] Goldin, C. 2022. https://www.brookings.edu/bpea-articles/understanding-the-economic-impact-of-covid-19-on-women/
[4] The term “women maintaining families” is defined as a never-married, divorced, widowed, or separated woman with no husband present and who is responsible for her family .
————![]()
Author: Zuzana Bednarikova, zbednari@purdue.edu
Dr. Zuzana Bednarikova is a Research and Extension Specialist at NCRCRD
