
Every year, in February, America celebrates Black History Month to acknowledge the achievements of African Americans and their crucial role in U.S. history. In recognition of the Black population’s contributions to the nation, we dedicated this article to the economic progress that Black households in the U.S. and the Midwest have made in the last decade.
In 2019, the median Black household income[1] in the U.S. reached $43,862, which is a 10% increase compared to 2010.[2] Median Black household income also increased in the North Central Region (NCR), although 3% less than in the U.S., from $34,535 in 2010 (adjusted to 2019 dollars) to $37,241 in 2019.
Despite growth in median Black household income between 2010 and 2019, an income gap persists across all racial and ethnic groups in the U.S. and NCR states. The median Black household income was the lowest compared to other racial and ethnic groups in 2010 (in 2010 dollars). Specifically in Iowa, this income was only $22,810 in 2010. South Dakota was the only state where the Black household income was higher ($32,389) than another racial group – American Indian and Alaska Native ($22,170). Except for South Dakota, the highest median Black household income in 2010 was reported in Illinois ($32,866) and Indiana ($30,071).
Figure 1 shows positive changes in the median household income of the Black population in 2019 (compared to 2010) but also more significant income gaps across racial and ethnic groups and NCR states. The NCR states with the highest median Black household income in 2019 include South Dakota ($52,246), Minnesota ($41,570), and Kansas ($40,818).
Figure 1. Median household income in the U.S. and NCR in 2019

Source: U.S. Census Bureau – American Community Survey
Median Black household income increased in all Midwest states (Table 1) between 2010 and 2019, ranging from 2.7% in Indiana and 3% in Illinois to 27.2% in South Dakota, 24.6% in Iowa, and 24.1% in Minnesota. Nevertheless, this trend is not typical for all racial and ethnic groups. American Indian and Alaska Native households in Iowa and Missouri and Asian households in North Dakota experienced a significant decrease in median household income.
Table 1. Median household income change in the U.S. and NCR between 2010 (in 2019 dollars) and 2019
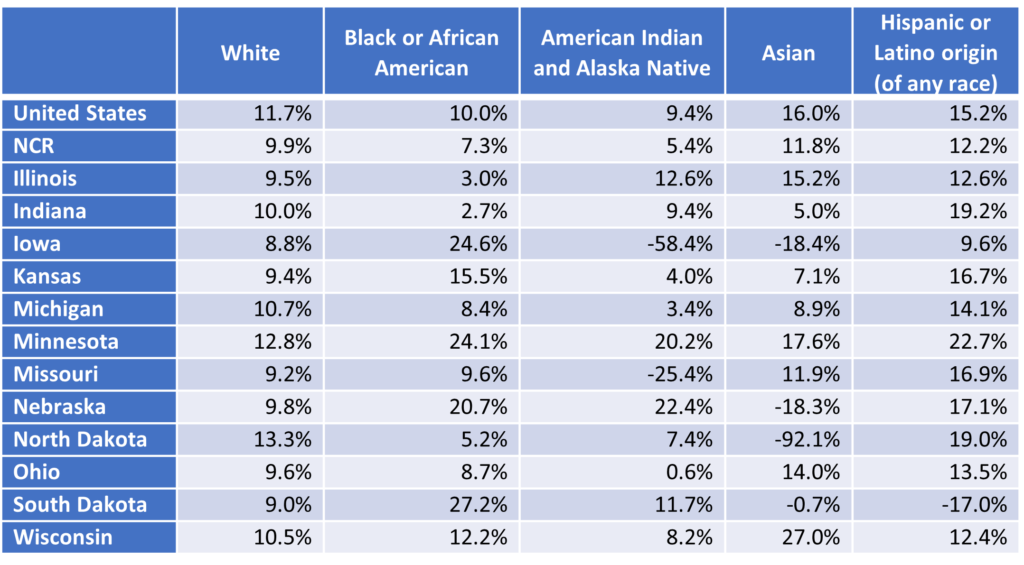
Source: U.S. Census Bureau – American Community Survey
What is behind this progress in Black household income? There are many reasons, but one most probable factor is rising employment opportunities. A report released by Brookings Institution reveals that Black adults’ employment grew significantly in most metropolitan areas between 2013 and 2018, mainly in the West and South. In Midwest, two metro areas registered a strong increase in median Black household income: Chicago-Naperville-Elgin, IL-IN-WI, from $36,989 in 2013 to $41,181 in 2018, and Cincinnati, OH-KY-IN, from $30,944 to $37,333.[3]
However, the years of a COVID-19 pandemic negatively impacted Black household income and employment. In the U.S. Census Bureau Household Pulse Survey, the respondents across the nation indicated that they had experienced a 48.8% loss of employment income (for self or household members) between March 2020 and March 2021.[4]
The results of the Household Pulse Survey for NCR states are displayed in Figure 2. The share of Black respondents that experienced a loss of employment income between March 2020 and March 2021 varies by state and ranges from no one in South Dakota to 26.5% in Nebraska, 64.4% in Michigan, and 100% in North Dakota.
Figure 2. Percent of Black respondents that experienced a loss of employment income between March 2020 and March 2021 (for self or household member)

Source: U.S. Census Bureau Household Pulse Survey, Week 27
The increase in the unemployment rate for Black people continues and has been constantly highest amongst race groups. The unemployment rate for Black people reached 7.1% in December 2021, but the unemployment rate for Black teens (aged between 16 and 19) was 21% which is 12.4% higher than white teens. The primary employers of teens are in retail and hospitality, and the pandemic has negatively impacted jobs in these sectors. Black women represent another group with a high unemployment rate. Their unemployment rate increased from 6.5% in November 2021 to 7.1% in December 2021.[5] These numbers show racial disparities in the labor market recovery and that more time is needed to narrow the racial gap in employment.
References
[1] Brookings Institute. https://www.brookings.edu/blog/the-avenue/2019/10/03/black-household-income-is-rising-across-the-united-states/
[2] U.S. Census Bureau Household Pulse Survey, Week 27. https://www.census.gov/data/tables/2021/demo/hhp/hhp27.html
[3] A median household income means that the median divides the income distribution into two equal parts: one-half of the cases falling below the median income and one-half above the median. An extended definition of median household income by U.S. Census Bureau can be found at https://www.census.gov/quickfacts/fact/note/US/INC110219
[4] American Community Survey, ACS 1-Year Estimates Subject Tables 2010 and 2019. We used the Retrospective Series (R-CPI-U-RS) to inflation adjust an income estimate from 2010 dollars to 2019 dollars.
[5] Brookings Institute. https://www.brookings.edu/blog/the-avenue/2022/01/11/decembers-jobs-report-reveals-a-growing-racial-employment-gap-especially-for-black-women/?utm_campaign=Brookings%20Brief&utm_medium=email&utm_content=200712946&utm_source=hs_emailAuthor
Dr. Zuzana Bednarikova is a Research and Extension Specialist at NCRCRD