In recognition of National Poverty in America Awareness Month, the U.S. Census Bureau provided a picture of poverty in the U.S. They used two poverty measures to demonstrate poverty in the U.S. from different perspectives. These different measures can present a unique picture for the number of people in poverty in the Midwest, even as they show little difference in the number of people in poverty across the U.S.
Measuring poverty and exploring ways to address it took the national stage in 1964 when the Johnson administration declared a “War on Poverty.” At that time, the Official Poverty Measure (OPM) was established by the Office of Management and Budget. The definition of the measure that is based on the pretax cash income of an individual or a family has stayed relatively static since it was first published in the mid-1960. In contrast, Supplemental Poverty Measure (SPM) was introduced in 2011 and was designed to capture cash and noncash sources and benefits and subtract expenses.[1]
As poverty measures have an important effect on government policies and programs, a comparison of these two different measures allows researchers, practitioners, and policymakers to consider their meaning and implications on policy and systems of support.
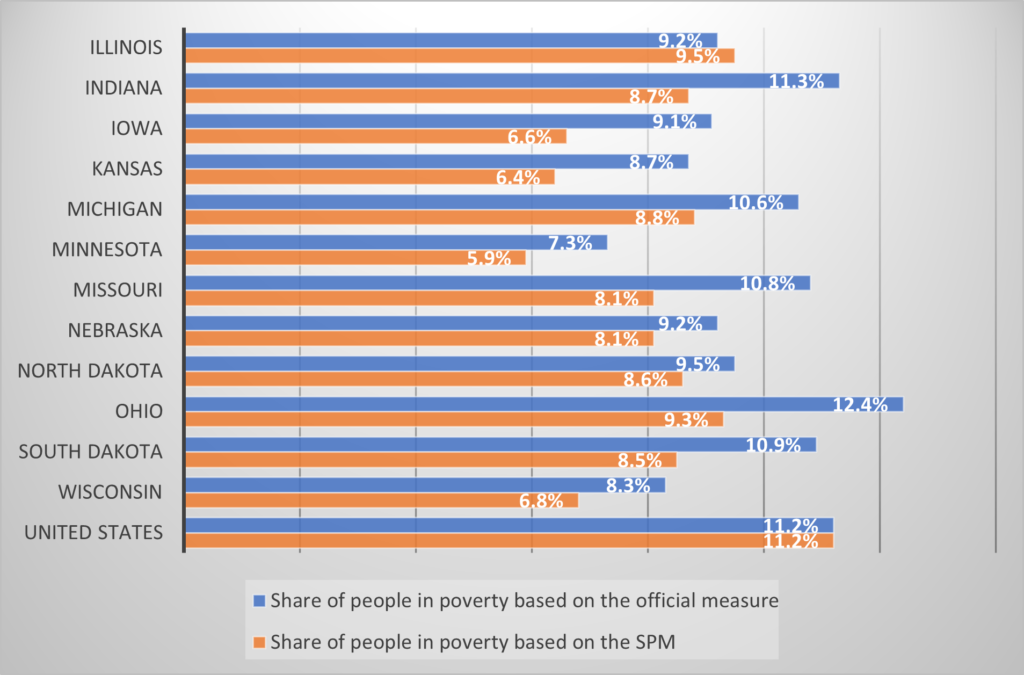
The U.S. Census Bureau released data related to these two poverty measures as a 3-year average of 2018 – 2020. Figure 1 displays shares of people in poverty in the Midwest and the U.S. based on the OPM. The poverty measure ranges from 7.3% in Minnesota to 12.4% in Ohio. The average official poverty rate in Midwest was 9.8% which is lower than in the U.S. (11.2%). The share of people in poverty based on the SPM ranged from 5.9% in Minnesota to 9.5% in Illinois. The average SPM in the Midwest was 7.9%, much lower than in the U.S. (11.2%).
Usually, the SPM poverty rate estimates differ (exceeds) from the OPM rates as their composition varies among demographic and socioeconomic groups based on age, race, Social Security beneficiary status, etc. Also, SPM estimates reflect the tax impact (payroll and income taxes and refundable tax credits) and in-kind government benefits, such as food stamps (SNAP), housing subsidies, and other benefits.
The research focused on differences between the SPM and OPM rates and conducted by Social Security Administration in 2015 indicates that poverty measured by SPM is lower among people under 18 years old and higher among people aged 65 and older. Moreover, children living outside Metropolitan Statistical Areas, those living in households without a mortgage, and those living in the Midwest experienced the most significant poverty decrease.[2]
The lower SPM poverty rate in the Midwest reflects geographic differences in lower housing costs in non-metropolitan areas. The Midwest is a region with a high share of rural population ranging from 12% in Illinois to 43% in Dakota. SPM rates also consider socioeconomic aspects. As a result, SNAP benefits, refundable tax credits, and other noncash transfers significantly reduce the poverty of white and black children than Asian children. In terms of race and ethnicity, Midwest is a region with a high share of white population ranging from 61.4% in Illinois to 84.5% in Iowa. Midwest states with the highest percentage of black and African American people are Illinois (14.1%) and Ohio (12.5%).
Although uncommon, the SPM rates in 2020 were below the OPM rates. SPM included stimulus payments and therefore were at their lowest level since 2011.[3]
Figure 1. Poverty rates using the Official and Supplemental Poverty Measures, the 3-year average of 2018 – 2020

Source: U.S. Census Bureau
Stimulus payments are direct payments to the families provided by the U.S. government in response to COVID-19. Three stimulus checks have been paid since March 2020. The first two – Coronavirus Aid, Relief, and Economic Security Act; and additional stimulus check authorized in December 2020 affected the SPM rates in 2020. The third stimulus – American Rescue Plan Act, became available on March 2021 and will most likely influence SPM rates in 2021.
Stimulus payments lifted 11.2 million people out of poverty in the U.S. in 2020. The payments significantly reduced the proportion of children experiencing poverty; mainly Black child poverty decreased from 23.7% to 16.9%. However, the largest group of people lifted out of poverty were individuals between 18 and 64 years old.[4] The American Rescue Plan also provided state, local, territorial, and Tribal government funding. The resources enable state, local, and Tribal governments to invest in infrastructure (water, sewage, and broadband services), provide relief for homeowners, fund small business credit expansion initiatives, and extend employee retention efforts and unemployment compensation.[5]
Geographic variations
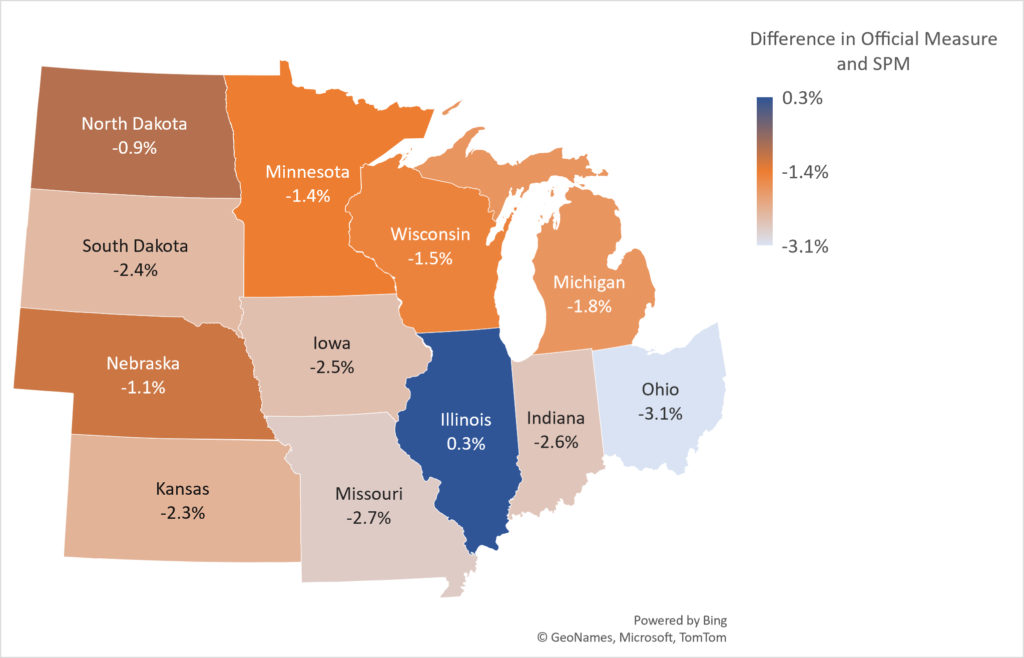
Figure 2 compares an OPM and SPM by the Midwest states and in the U.S. The SPM was lower than the official measure in all Midwest states except Illinois (0.3%) and ranged from -3.1% (Ohio) to -0.9% (North Dakota). The SPM in Illinois was 0.3% higher than the official measure, which the U.S. Census Bureau does not consider statistically different.[6]
Figure 2. The difference in poverty rates by Midwest states using the Official and Supplemental Poverty Measures, the 3-year average of 2018 – 2020

Source: U.S. Census Bureau
______________________
[1] Detailed information about major concepts and differences between official and supplemental poverty measures can be found at
Official Poverty Measure Definition: https://www.census.gov/topics/income-poverty/poverty/guidance/poverty-measures.html
Supplemental Poverty Measure Definition: https://www.census.gov/newsroom/blogs/random-samplings/2018/09/what_is_the_suppleme.html
Difference between Official and Supplemental Poverty Measures: https://www.census.gov/newsroom/blogs/random-samplings/2021/09/difference-between-supplemental-and-official-poverty-measures.html#:~:text=The%20first%2C%20called%20the%20official,as%20taxes%20and%20medical%20expenses).
[2] Social Security Administration: https://www.ssa.gov/policy/docs/ssb/v75n3/v75n3p55.html#mn9
[3] U.S. Census Bureau: https://www.census.gov/library/stories/2022/01/national-poverty-in-america-awareness-month-measuring-poverty.html?utm_campaign=20220124msacos1ccstors&utm_medium=email&utm_source=govdelivery
[4] U.S. Census Bureau: https://www.census.gov/library/stories/2021/09/who-was-lifted-out-of-poverty-by-stimulus-payments.html
[5] U.S. Department of Treasury: https://home.treasury.gov/news/featured-stories/fact-sheet-the-american-rescue-plan-will-deliver-immediate-economic-relief-to-families
[6] U.S. Census Bureau: https://www.census.gov/library/stories/2022/01/national-poverty-in-america-awareness-month-measuring-poverty.html?utm_campaign=20220124msacos1ccstors&utm_medium=email&utm_source=govdelivery
————![]()
Author: Zuzana Bednarikova, zbednari@purdue.edu
Dr. Zuzana Bednarikova is a Research and Extension Specialist at NCRCRD
