September 15 to October 15 is national Hispanic American Heritage Month. During this Month, Americans pay tribute to the generations of Hispanic Americans who have positively influenced and enriched the U.S. nation and society. People celebrate the history, culture, and contributions of American citizens whose ancestors came from Spain, Mexico, the Caribbean, and Central and South America.[1],[2]
Based on the U.S. Census Bureau, Hispanic or Latino refers to a person of Cuban, Mexican, Puerto Rican, South or Central American, or other Spanish culture or origin regardless of race.[3] Moreover, the Hispanic origin can be seen as the nationality, lineage, heritage, or country of birth of the person or the person’s parents or ancestors before arriving in the U.S.[4]
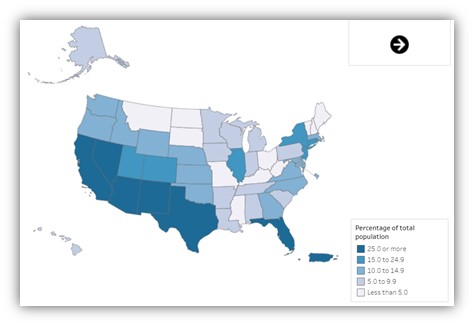
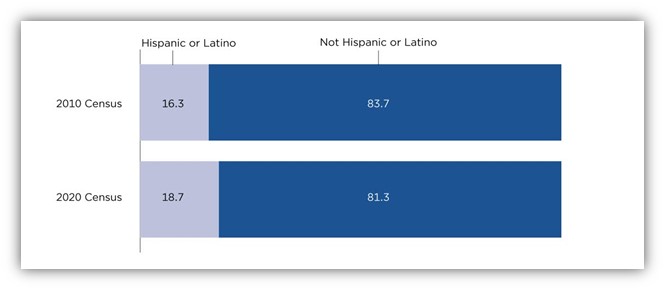
The Hispanic or Latino population was 62.1 million in the U.S. in 2020 and represented 18.7% of the U.S. population.[5] This group concentrates mainly in the southern and western part of the country, specifically in New Mexico (47.7% of the state’s population), California (39.4%), Texas (39.3%), Arizona (30.7%), Nevada (28.7%), and Florida (26.5%) (Figure 1).
Figure 1. Percent of Hispanic or Latino population by state in 2020

Source: U.S. Census Bureau, Race and Ethnicity in the United States
Between 2010 and 2020, the Hispanic or Latino population grew by 23%, while the population that was not of Hispanic or Latino origin grew by 4.3% (Figure 2).[6]
Figure 2. Percentage distribution of the Hispanic or Latino population in 2010 and 2020

Source: U.S. Census Bureau, Race and Ethnicity in the United States
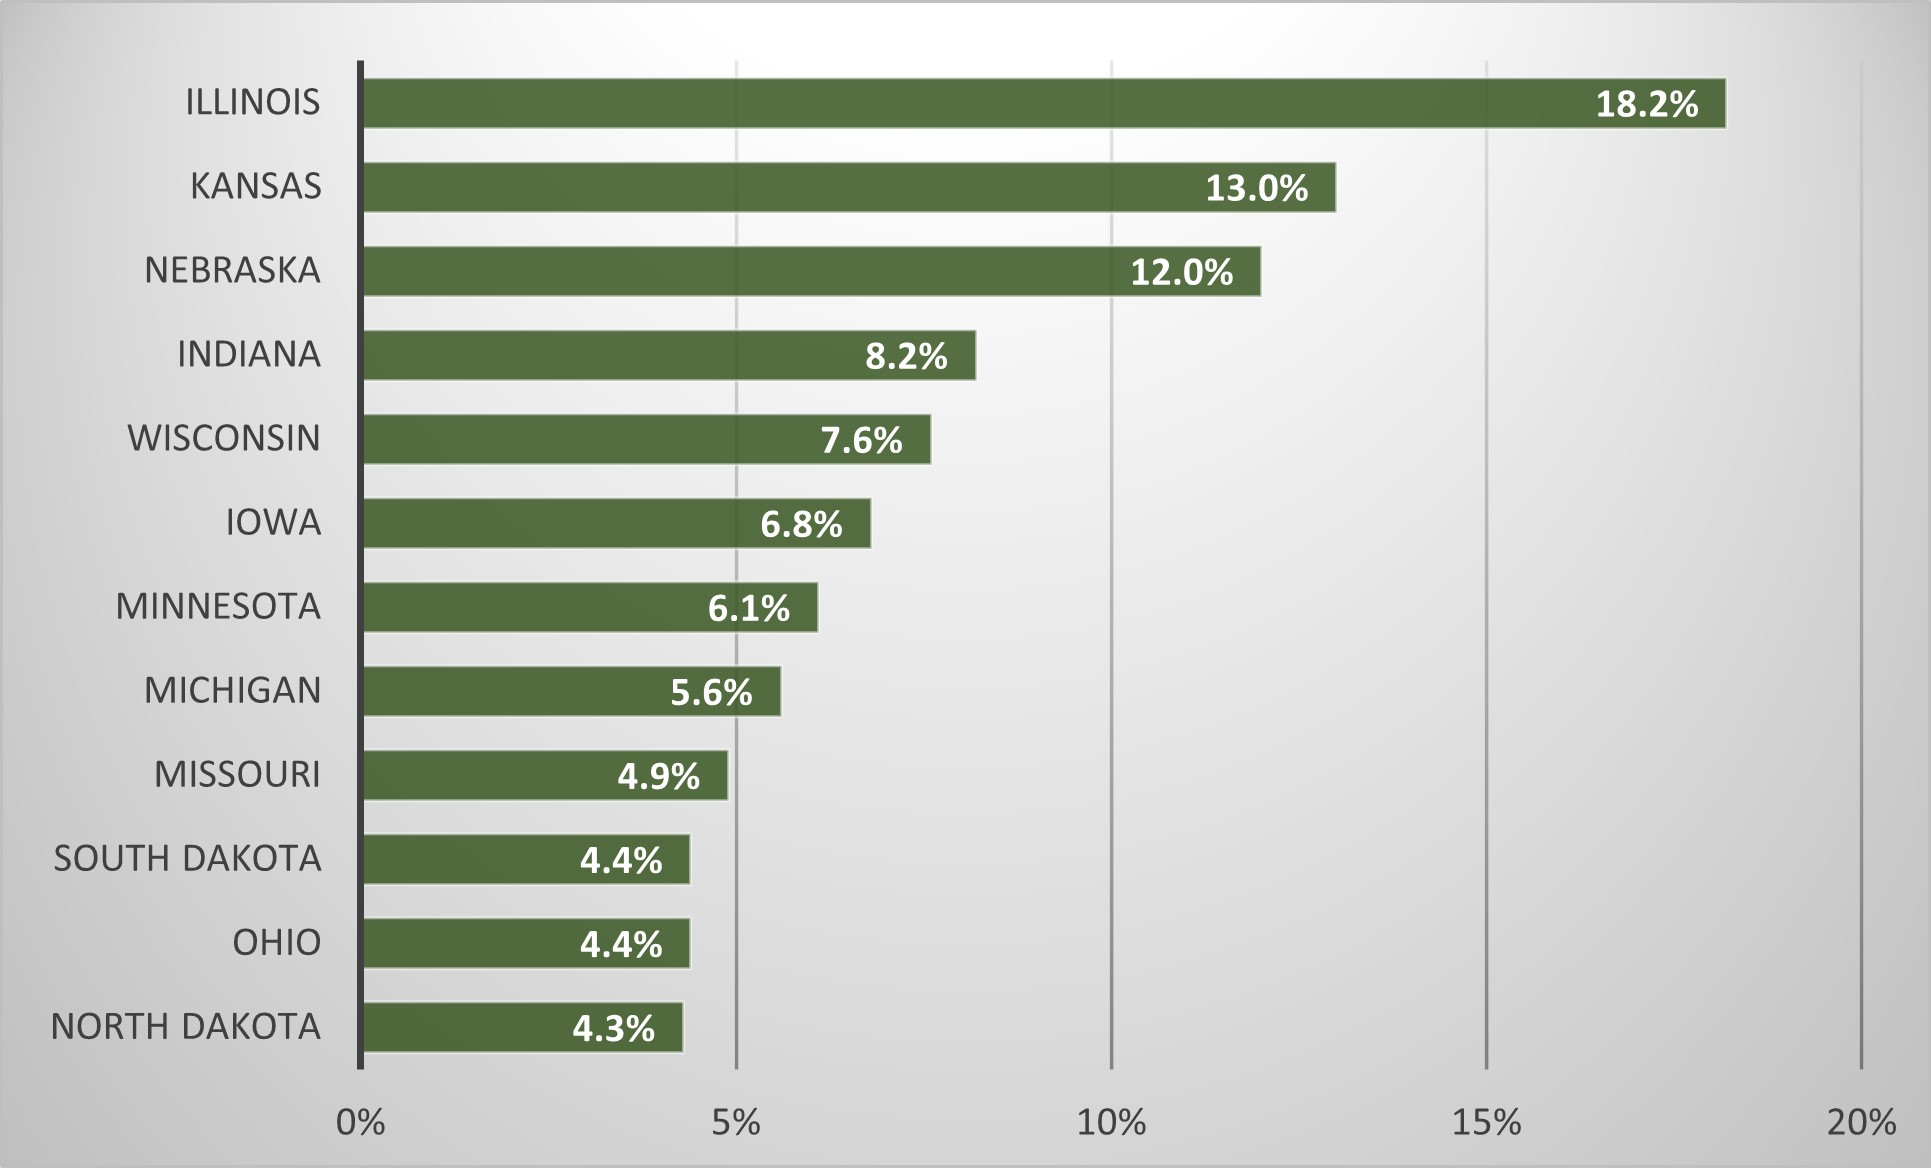
Figure 3 shows most of the states in the North-Central Region stay behind the national number in terms of the share of the Hispanic or Latino population. The percentage of people that fall into this category was lowest in North Dakota, Ohio, and South Dakota and represented less than 4.5% in 2020. On the contrary, Illinois had the highest share of this ethnic group from the North-Central Region states, reaching 18.2%, slightly lower than the national percentage.
Figure 3. Percent of Hispanic or Latino population by state in North-Central Region in 2020

Source: U.S. Census Bureau, Race and Ethnicity in the United States
[1] U.S. Census Bureau: https://www.hispanicheritagemonth.gov/
[2] U.S. Census Bureau: https://www.census.gov/newsroom/stories/hispanic-heritage-month.html
[3] U.S. Census Bureau: https://www.census.gov/quickfacts/fact/note/US/RHI725219
[4] U.S. Census Bureau: https://www.census.gov/topics/population/hispanic-origin.html
[5] U.S. Census Bureau: https://www.census.gov/library/stories/2021/08/improved-race-ethnicity-measures-reveal-united-states-population-much-more-multiracial.html
[6] https://www.census.gov/library/stories/2021/08/improved-race-ethnicity-measures-reveal-united-states-population-much-more-multiracial.html
Author: Zuzana Bednarikova, zbednari@purdue.edu
Dr. Zuzana Bednarikova is a Research and Extension Specialist at NCRCRD.
