
By Savanna Gratny, Undergraduate Research Assistant, Iowa State University and Samuel C.H. Mindes, Assistant Professor, Iowa State University
Introduction
Access to affordable, stable, and safe housing is a key determinant of one’s quality of life. The absence of these factors defines what housing insecurity looks like in the United States (Deluca & Rosen, 2022). However, persistent disparities in economic, structural, and geographic factors continue to perpetuate housing insecurity across the North Central Region (NCR). This report examines physical, financial, and demographic housing factors in the North Central Region using data from the NCR-Stat: Housing and Food Security Survey (Mindes et al., 2026). This snapshot provides a comprehensive overview of housing insecurity in the NCR by household location, support being utilized, and unmet needs.
Who is Affected
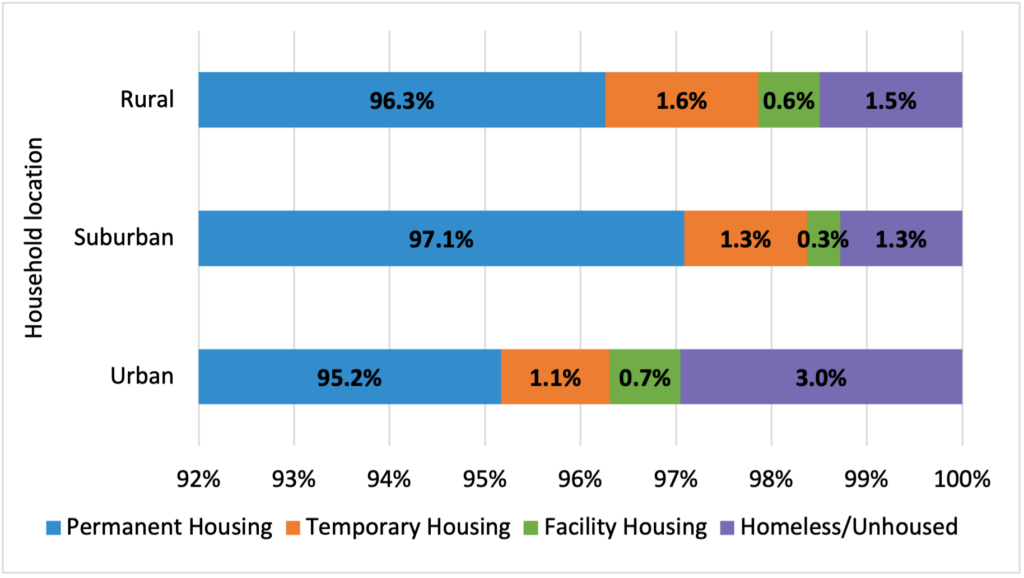
Of the sample collected by the NRC-Stat: Housing and Food Security Survey (N = 4,175), 41.6 percent of respondents reside in suburban areas, 35.8 percent in urban areas, and 22.6 percent in rural areas. Across geographic locations, disparities exist in the types of homes respondents live in (see Figure 1). The prevalence of individuals living in temporary housing, residing in facility housing, or unhoused can be an indicator of housing vulnerability. Permanent housing includes owned or rented homes; temporary housing includes shelters, transitional housing, or short-term arrangements; facility housing includes institutional settings; and unhoused refers to respondents without stable housing. As shown in Figure 1, urban respondents have a higher unhoused rate (3.0 percent) than rural (1.5 percent) and suburban (1.3 percent) respondents. Rural areas have the highest percentage of respondents in temporary housing (1.6 percent). Overall, suburban areas have the highest percentage of individuals living in permanent housing (97.1 percent). Although more than 95 percent of respondents in each geographic area were in permanent housing, this survey is unlikely to capture many individuals in certain types of non-permanent housing.
Figure 1. Distribution of housing types across urban, suburban, and rural households (N = 4,144)
Source: NCR-Stat: Housing and Food Security Survey (Mindes et al., 2026)
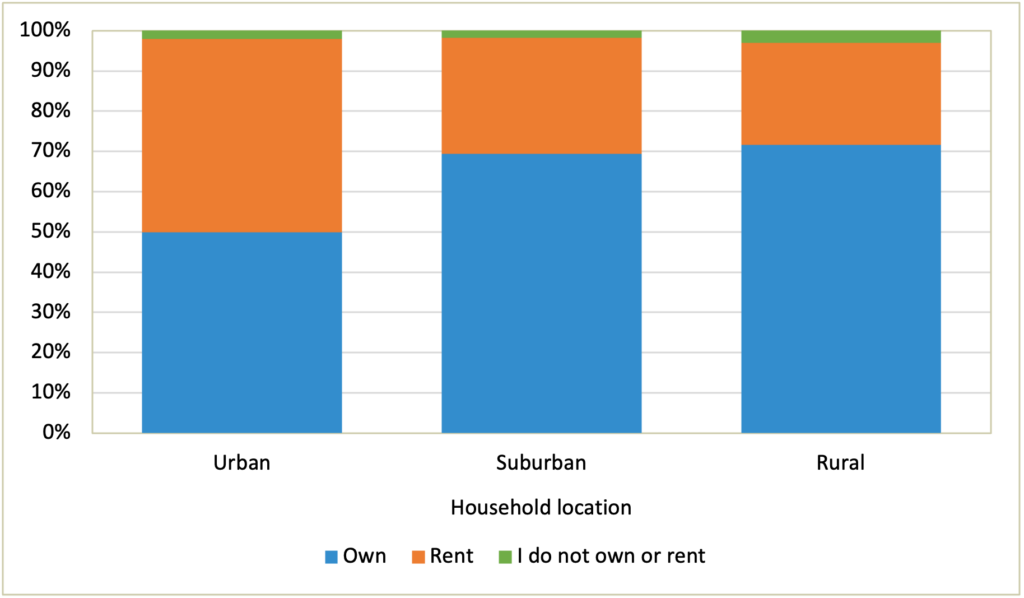
Renting and ownership rates varied across geographic areas in the NCR as well, illustrated in Figure 2. Among survey respondents, those living in rural and suburban areas more often own their own homes (71.6 percent and 69.5 percent, respectively) than urban respondents. More urban respondents rent their homes, with 50.0 percent reporting renting, compared with 28.7 percent in suburban areas and 25.4 percent in rural areas. This reflects typical housing patterns across geographic areas, shaped by local housing stocks and availability, as well as market differences (Joint Center for Housing Studies of Harvard University, 2026). Overall, 63.0 percent of respondents owned their current home, 34.8 percent rented, and 2.1 percent did not rent or own.
Figure 2. Rates of homeownership, renting, and non‑ownership across household locations (N = 3,969)
Source: NCR-Stat: Housing and Food Security Survey (Mindes et al., 2026)
Housing Costs
Beyond differences in housing type and tenure, affordability plays a central role in shaping housing stability across the region. This pattern is particularly important when analyzing housing burden between rural and urban households in the North Central Region.
Housing cost burden (monthly rent or mortgage payment as a percentage of total monthly household income) is a commonly used indicator of housing insecurity, as it measures housing expenditures in the context of other household finances (Mateyka & Yoo, 2023). The NCR-Stat survey includes measures of annual household income and total monthly rent and mortgage; annual income was converted to monthly income. Each of these items was collected in dollar ranges on the survey, requiring special handling to estimate cost burden ratios without distorting the final metrics. Where possible, we assigned the midpoint for each income and housing cost category to use in the calculation for each respondent.
For the open-ended upper and lower categories, standard closed midpoints cannot be calculated, necessitating specialized bounds to avoid the mathematical distortions of a pure uniform distribution. For the lowest category, rather than assuming a flat midpoint between zero and the category maximum, we utilized a value representing we used a value that was 80 percent of the category’s maximum (i.e., rent or mortgage of $400 or income of $20,000). For the highest open-ended category, we maintained structural consistency across both variables by using a value 20 percent beyond the minimum value for that bin (i.e., rent or mortgage of $3,600 and income of $360,000). Standard economic algorithmic modeling (such as a Pareto tail multiplier) is optimized for macro-level wealth inequality rather than localized household budgets. Though alternative estimation frameworks exist for top- and bottom-coded data, this symmetric, bounded approach provides a more cautious, transparent, and descriptively grounded estimate.
These steps ensure that the cost burden calculation remains as reflective of respondents’ lived finances as possible, while working within the limitations of categorical survey data.
The calculation yields a percentage indicating the share of monthly income spent on rent/mortgage payments, which is commonly broken into three levels (Mateyka & Yoo, 2023). The three housing burden levels are: not burdened (≤ 30 percent), cost-burdened (30-50 percent), and severely cost-burdened (>50 percent). Some respondents lacked housing cost or income data, so we removed them from the analysis.
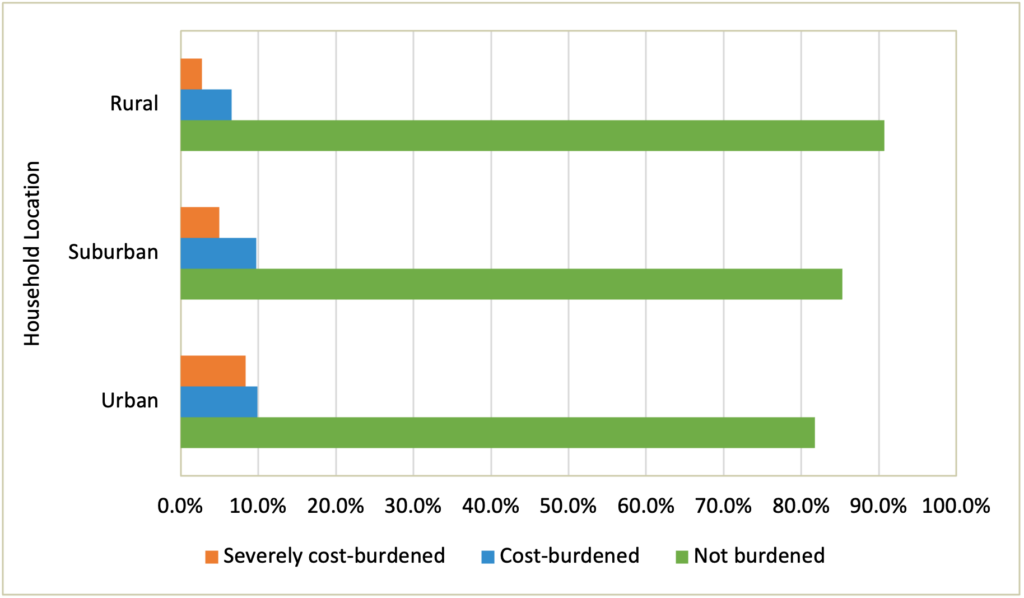
Housing cost burden is higher in urban and suburban areas than in rural areas (see Figure 3). Among respondents from rural areas, 9.3 percent were cost-burdened (either level), compared to 14.7 percent in suburban areas and 18.3 percent in urban areas. The survey shows that severe cost burden is also experienced at higher rates in more population dense areas: 2.7 percent in rural areas, 4.9 percent in suburban areas, and 8.4 percent in urban areas. This pattern is likely due to lower absolute housing and land costs in rural compared to urban and suburban areas.
Figure 3. Share of households experiencing housing cost burden, by location (N = 3,643)
Source: NCR-Stat: Housing and Food Security Survey (Mindes et al., 2026)
Use of Assistance Programs
Affordability is another dimension of housing insecurity. Access to support programs varies across communities and can influence households’ ability to navigate housing challenges. Table 1 shows disparities in participation in housing and renting education programs by household location. Urban respondents reported participation in housing and renting education programs more than three times as often as rural respondents (18.4 vs. 5.9 percent) and more than twice as often as suburban respondents (18.4 vs. 8.6 percent). Although rural and suburban respondents face a housing cost burden at a rate similar to that of urban and suburban respondents, rural respondents participate in housing and rental education programs less often. This pattern could suggest potential barriers to access, differences in program availability, or a knowledge gap.
Table 1. Rates of participation in housing and renting education programs across household locations (N = 4,162)
| Participation | Urban | Suburban | Rural | Total |
| No | 81.6% | 91.4% | 94.1% | 88.5% |
| Yes | 18.4% | 8.6% | 5.9% | 11.5% |
| Total valid responses | 1,493 | 1,730 | 939 | 4,162 |
Source: NCR-Stat: Housing and Food Security Survey (Mindes et al., 2026)
Housing Conditions
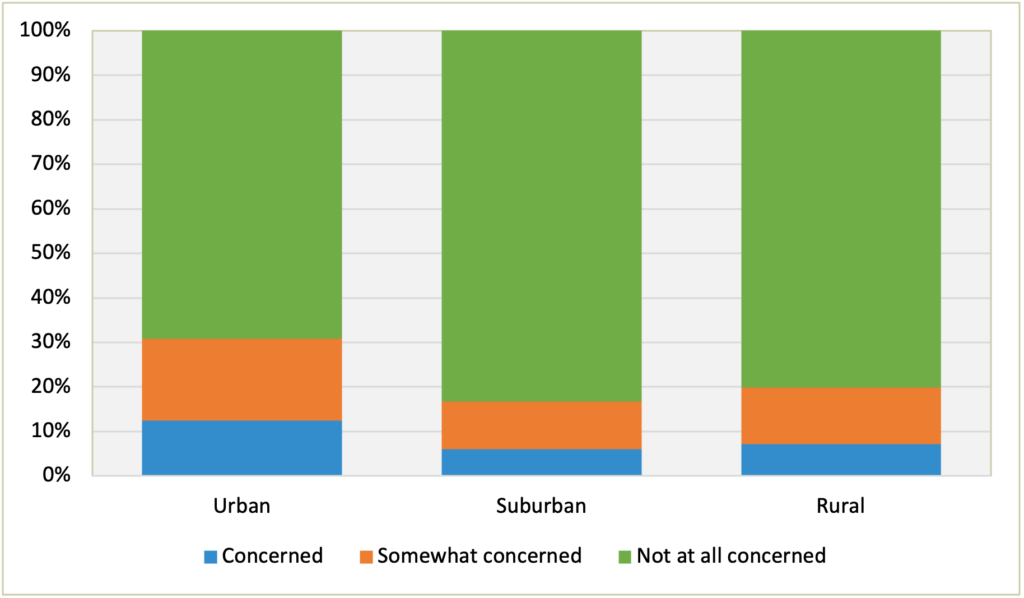
In addition to financial strain and program access, the physical condition of housing is an important indicator of housing insecurity, as poor conditions may reflect both financial strain and physical vulnerability (i.e., an unsafe structure or living conditions). According to the NCR-Stat data, fewer rural respondents compared to urban residents were concerned about the safety of their homes, with 19.8 percent indicating some level of concern (see Figure 4). Roughly 31 percent of urban respondents reported some level of concern with the safety of their home. Suburban respondents were least concerned with the safety of their home, with 83.3 percent indicating no concern at all. External place-based factors, such as attachment to a geographic location, may be relevant to these trends because they can influence respondents’ decisions to remain in locations despite structural safety concerns and cost burdens. Place-based ties may be more common among rural residents and those who have lived in their current home for longer.
Figure 4. Reported level of concern about home safety among urban, suburban, and rural households (N = 4,156)
Source: NCR-Stat: Housing and Food Security Survey (Mindes et al., 2026)
Patterns in housing conditions also differ by how long respondents have lived in their current homes, shown in Figure 5. Among respondents, those who have lived in their current residence longer more frequently reported that repairs are needed to ensure overall safety or functionality, reflecting both aging structures and accumulated maintenance needs. Among individuals who have lived in their residence their entire lives, over 50 percent indicated that safety repairs are needed, compared to roughly 27 percent of those who have lived in their residence for less than one year. This trend is consistent: longer residence correlates with reporting that home repairs are needed for safety or functionality. This challenge is meaningful, as the inability to afford the repairs needed for safety and functionality can compound into a larger burden on a household. The age of respondents’ homes may also be relevant, which future analysis should explore.
Figure 5. Whether safety‑related repairs are needed, by length of residence (N = 4,149)

Source: NCR-Stat: Housing and Food Security Survey (Mindes et al., 2026)
Repair needs relate to the ability to afford routine maintenance, which varies by length of residence (see Figure 6). Similar to the link between length of residence in a home and the need for repairs, length of residence also relates to the inability to afford home maintenance and repairs. The less time a respondent has spent in their current location, the more frequently they reported an inability to afford regular maintenance. Among respondents who have lived in their residence for less than 1 year, 22.3 percent reported they are never or rarely able to afford routine maintenance, compared with 2.3 percent of respondents who have lived in the residence for their entire life. Individuals who have lived in their residences for 20+ years (but not their entire life) most often reported always being able to afford routine maintenance at 74.1 percent. Overall, longer-term residents are generally better able to afford maintenance needs.
Figure 6. Frequency of ability to afford routine home maintenance, by time lived in current residence (N = 4,130)

Source: NCR-Stat: Housing and Food Security Survey (Mindes et al., 2026)
Key Takeaways
- Housing cost burden exists in all geographic areas, but it is more prevalent in suburban and urban areas, likely a result of contextual differences in housing markets and population density.
- Urban residents face higher rates of renting and higher rates of concern about home safety, while rural and suburban residents report more homeownership.
- Longer-term residents more often report needed repairs, reflecting aging housing stock, but they can also more often afford routine maintenance.
- Participation in housing and renting education programs is uneven, with rural residents participating at the lowest rates, suggesting potential barriers to access or availability.
- Housing insecurity in the NCR is shaped by household financial circumstances, physical housing conditions, and geographic and structural factors, rather than a single driver.
Works Cited
Deluca, S., & Rosen, E. (2022). Housing Insecurity Among the Poor Today. Annual Review of Sociology, 48, 343–374.
Joint Center for Housing Studies of Harvard University. (2026). America’s Rental Housing 2026. www.jchs.harvard.edu/americas-rental-housing-2026
Mateyka, P. J., & Yoo, J. (2023). Share of Income Needed to Pay Rent Increased the Most for Low-Income Households From 2019 to 2021. US Census Bureau. https://www.census.gov/library/stories/2023/03/low-income-renters-spent-larger-share-of-income-on-rent.html
Mindes, S. C. H., Bednarik, Z., & Mori, S. (2026). North Central Region Household Data. NCR-Stat: Housing and Food Security Survey (Version 1.0, p. 4 files, 4 MB) Purdue University Research Repository. https://doi.org/10.4231/ZAVR-CE69
About the Authors
- Savanna Gratny, Undergraduate Research Assistant, Dept. of Sociology and Criminal Justice, Iowa State University
- Samuel C.H. Mindes, Ph.D., Assistant Professor, Dept. of Sociology and Criminal Justice, Iowa State University and Fellow, North Central Regional Center for Rural Development
Suggested Citation
Gratny, S.; Mindes, S. (2026). When Housing Isn’t Secure: Access, Affordability, and Stability in the North Central Region. Research Snapshot. North Central Regional Center for Rural Development. https://doi.org/10.22004/ag.econ.413083.