
In August 2021, the U.S. Census Bureau released the first results from the 2020 Census on race and ethnicity. These data provide a snapshot of the racial and ethnic composition and diversity on the national, state, and county levels as of April 1, 2020. The 2020 Census results revealed that America became more racially and ethnically diverse with a decline in the White population.[1]
Diversity is becoming more prevalent also in the North-Central Region (NCR). Figure 1 clarifies that the White population decreases in line with a national trend, and Latino or Hispanic and Asian Americans represent the fastest-growing group in the NCR.
Figure 1. Percent Population Change by State in the North-Central Region: 2010 to 2020
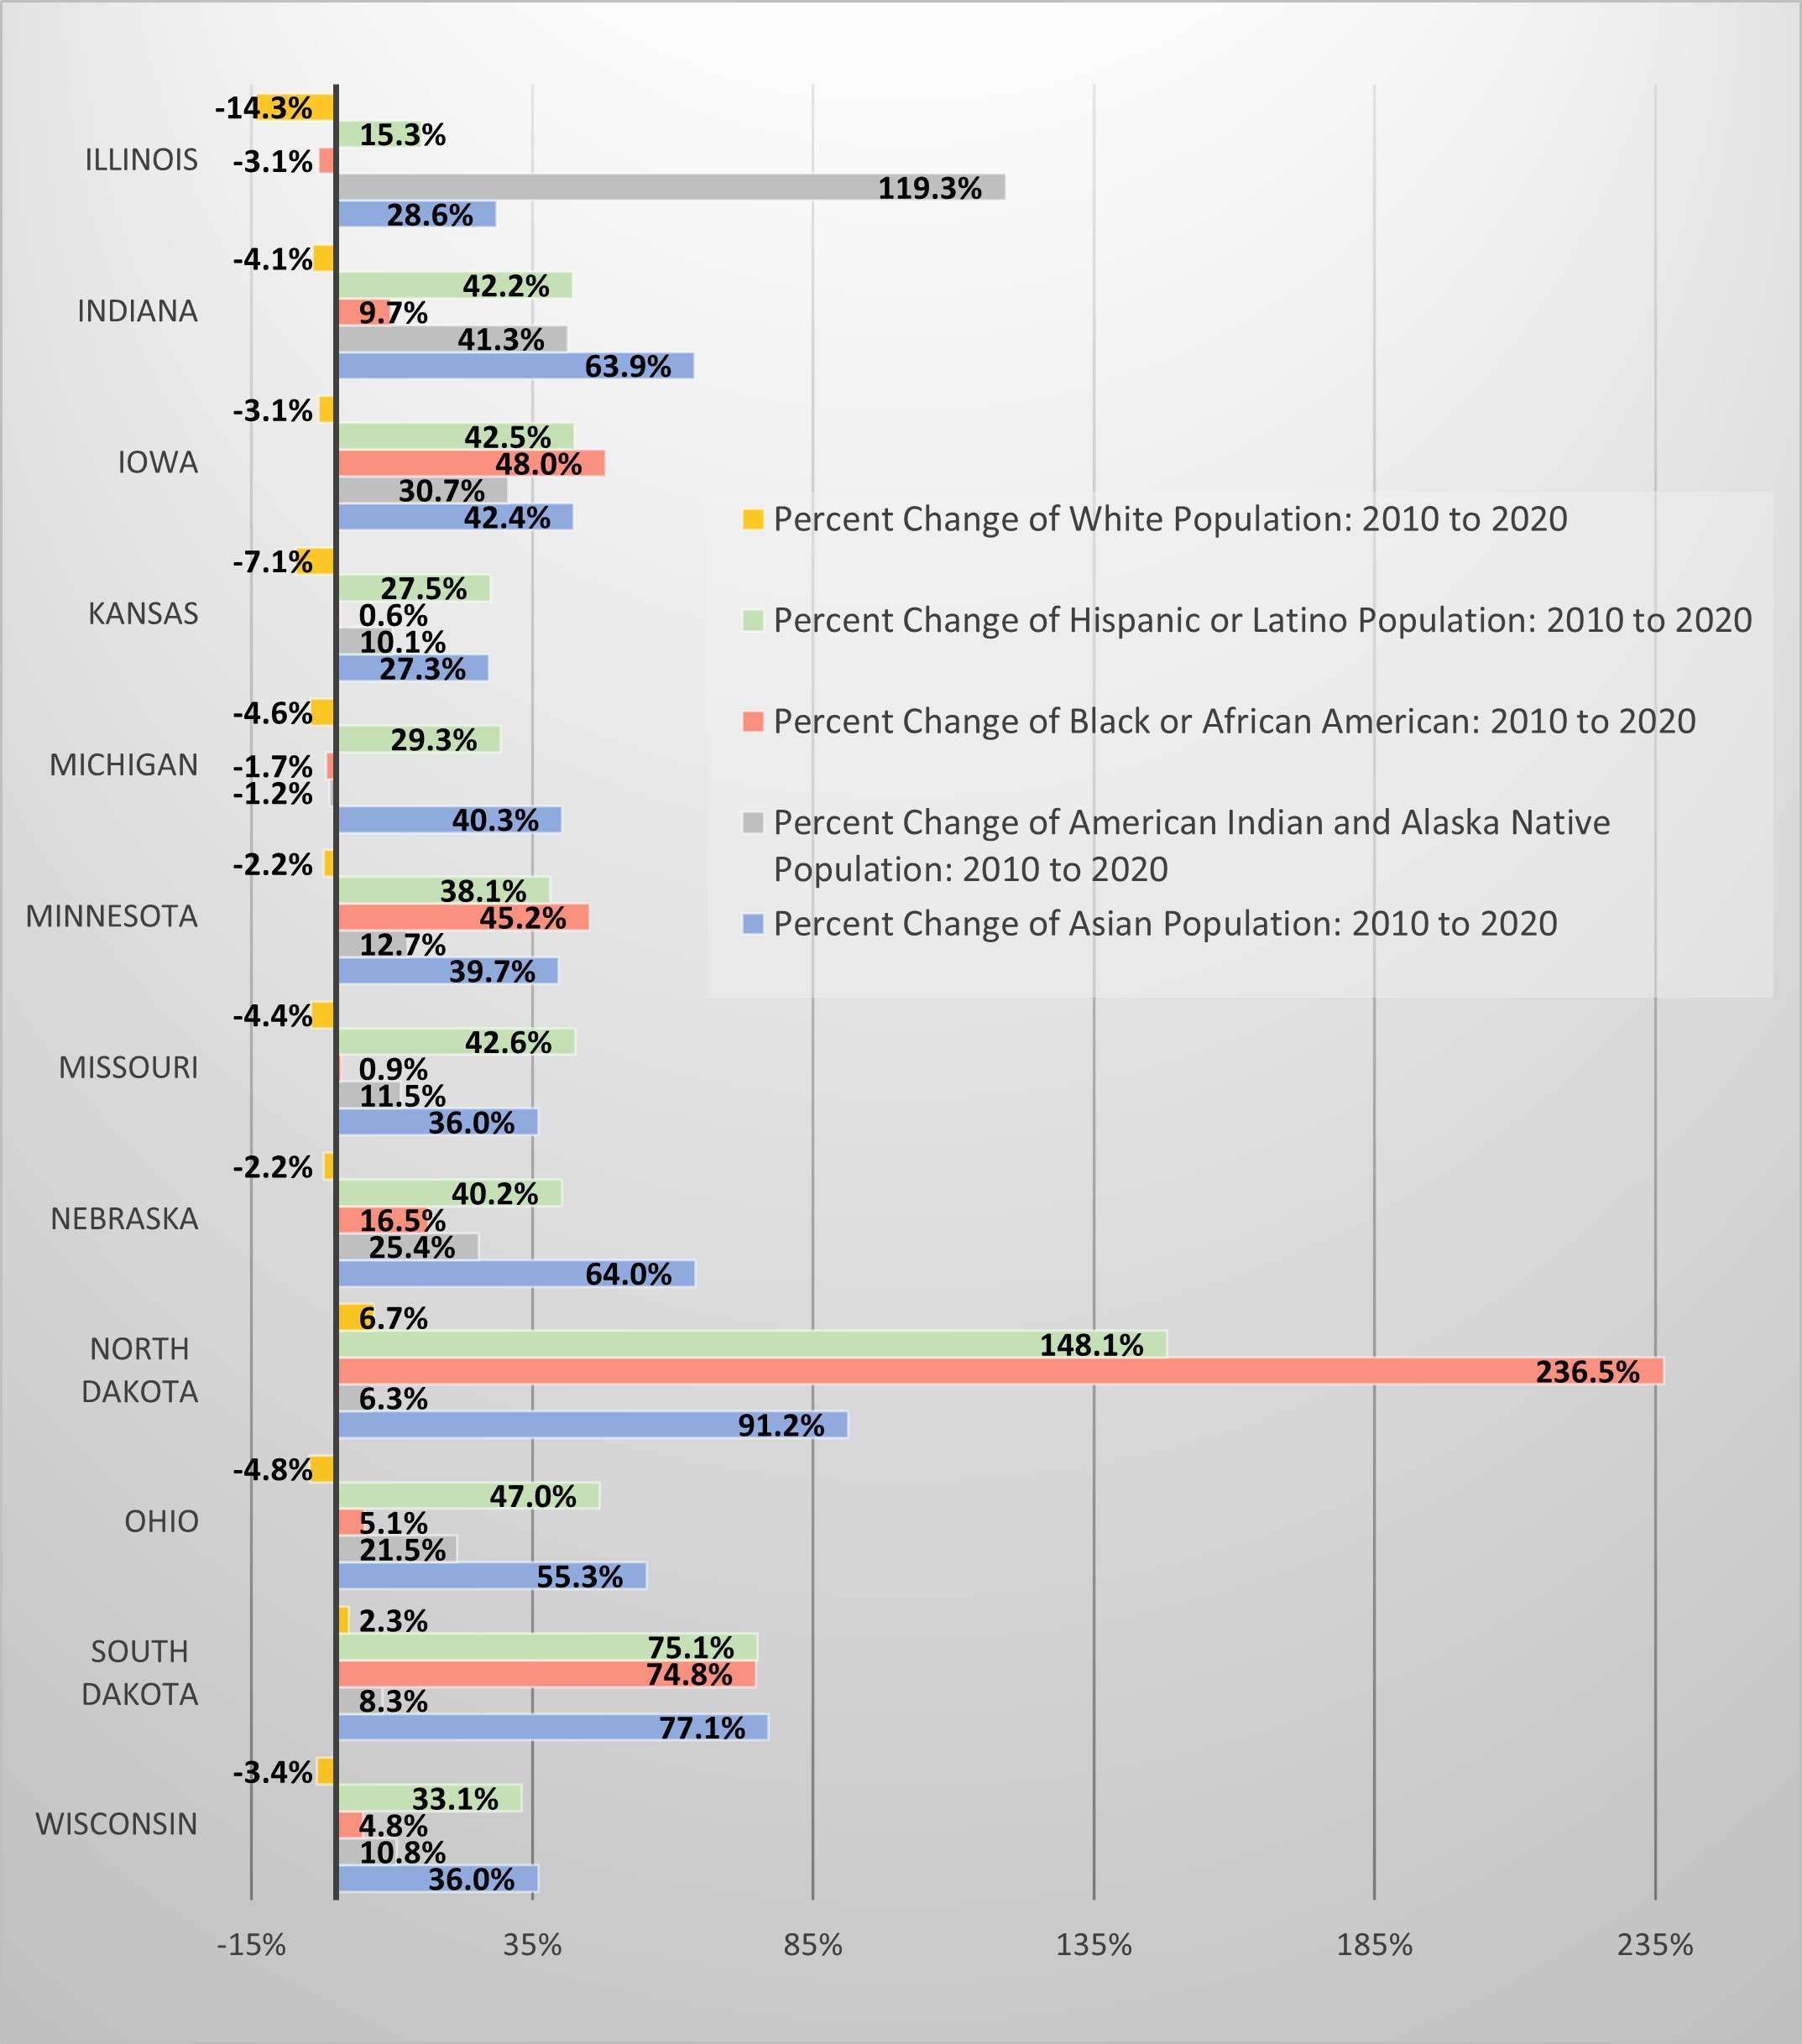 Source: The U.S. Census Bureau, 2021, Race and Ethnicity Prevalence by State 2020
In addition to the 2020 Census results, the U.S. Census Bureau compared these results to the results of the 2010 Census to present and analyze the complexity of the collected data using the following measures:
- Diversity Index.
- Prevalence Ranking and Diffusion Score.
- Prevalence Maps.
Diversity Index Ratio in the North Central Region
The U.S. Census Bureau uses the Diversity Index to measure “the probability that two people chosen at random will be from different racial and ethnic groups. The Diversity Index is bounded between 0 and 1. A value of 0 indicates that everyone in the population has the same racial and ethnic characteristics. A value close to 1 indicates that almost everyone in the population has different racial and ethnic characteristics.” The Bureau has converted the probabilities into percentages to make them easier to interpret. In this format, the “Diversity Index shows the chance that two people chosen at random will be from different racial and ethnic groups.”[2]
The U.S. Diversity Index calculations for 2020 and 2010 data indicate that the chance that two people chosen at random will be from different racial or ethnic groups has increased from 54.9% in 2010 to 61.1% in 2020. The national picture shows that NCR is the least diverse Region of the four U.S. Regions (North Central, Southern, Northeast, and Western Region) (Figure 2).[3] Illinois (60.3%) is the only state in NCR that comes close to the U.S. Diversity Index (61.1%). Cook County, Illinois, is especially notable as Latino or Hispanic, Asian American, and Black populations constitute larger percentages of the county population than nationally. Many NCR counties, where non-white racial or ethnic groups are significantly underrepresented, are small, less urban, and sparsely populated areas with a stagnating white population.[4]
Latino or Hispanic group has continued to disperse beyond the traditional metro areas like Chicago-Naperville-Elgin metro area. Thus, expanding diversity is primarily driven by growth in the rural Latino or Hispanic population in smaller towns and settlements in all parts of the NCR. Based on the Brookings analysis of 2010 and 2020 Census data, many Latino or Hispanic residents immigrated to work in meatpacking plants, farms, or industries like construction, oil, and timber, or to start a business.
The Black population increased primarily in the areas with rapid population growth in recent years, such as the shale gas fields of Western North Dakota. Thanks to the population growth in North Dakota, the Diversity Index jumped from 20.6% in 2010 to 32.6% in 2020. The indigenous population increased mainly in areas with historically large American Indian and Alaska Native populations. It declined in the shale gas areas in Western Dakota, most likely due to the influx of people from other parts of the country during the last decade.[5]
Figure 2. Diversity Index by state in the North-Central Region in 2010 and 2020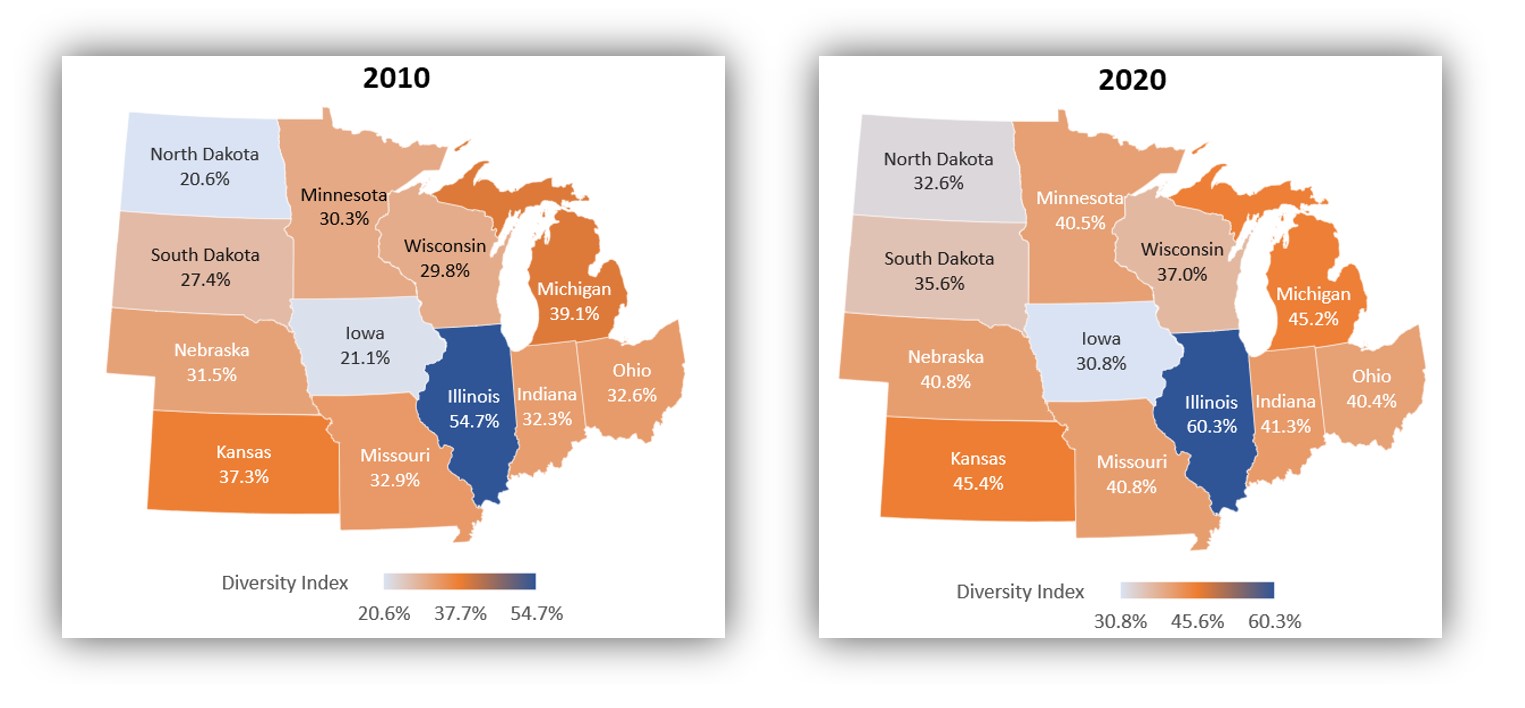 Source: The U.S. Census Bureau, 2021, Race or Ethnicity by State 2020
Prevalence Ranking and Diffusion Score
Prevalence ranking illustrates the percentage of the population that falls into the largest racial or ethnic group, second largest group, and third-largest group.
Diffusion scores measure the combined percentage of all racial and ethnic groups in the first, second, or third group. The higher the score, the less concentrated the population is in the three largest race or ethnic groups.[6]
Figure 3 shows that the White population constitutes the largest percentage of the population in each of the NCR states, especially in Iowa (84.5%), North Dakota (82.9%), South Dakota (80.7%), and Wisconsin (80.4%). The diversity profile differs in Illinois, with the lowest share of the white population (61.4%). Illinois has a large metropolitan area that has historically served as a destination for immigrants, Black migration to urban areas, and more recently for Latino or Hispanic and Asian individuals.
The second and third-largest group of population varies by state. Latino or Hispanic population as the second-largest group is larger in Illinois, Iowa, Kansas, Nebraska, and Wisconsin. Specifically in Wisconsin, the Hispanic or Latino population (7.6%) become the second-most prevailing group, surpassing the Black or African American population (6.4%). The Black or African American population is the second-largest in Indiana, Michigan, Minnesota, Missouri, and Ohio. American Indian and Alaska Native populations are highly represented in South Dakota and North Dakota
Figure 3. Share of racial or ethnic groups by state in the North-Central Region in 2020 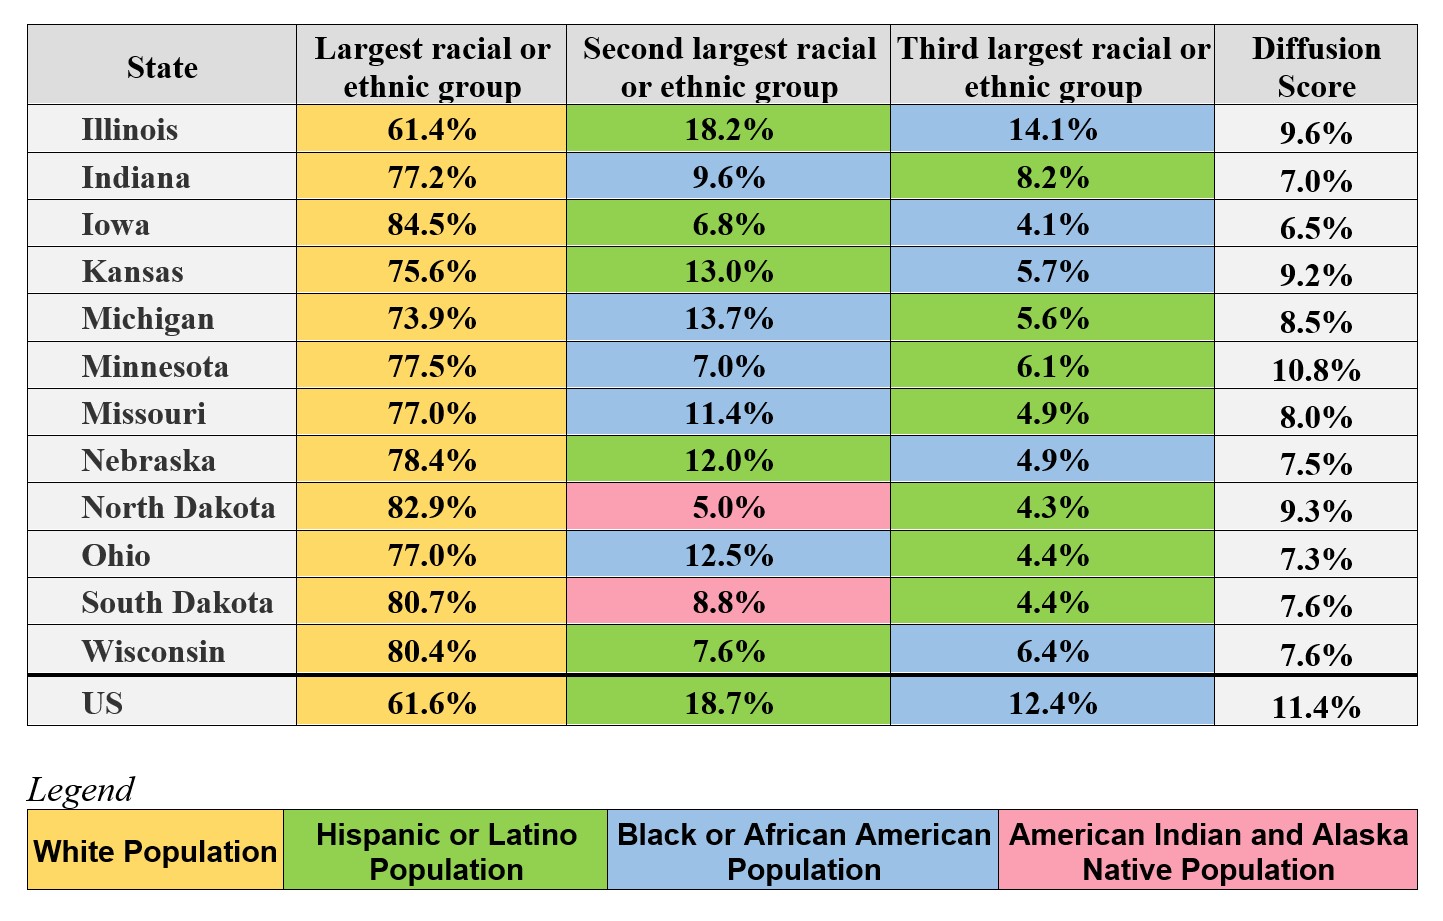 Source: The U.S. Census Bureau, 2021, Race and Ethnicity Prevalence by State 2020
Prevalence Maps
The Prevalence map shows the geographic distribution of the largest, second-largest, or third-largest racial or ethnic group at a specific geographic level. These maps help monitor regional spatial distribution patterns by race or ethnicity on the national, state, and county levels.[7]
Figure 4 demonstrates the White non-Hispanic population as the largest (most prevalent) racial or ethnic group for most counties in the NCR. Nevertheless, the map also indicates some regional variations. It means that other racial or ethnic groups represent the most prevalent population in some parts of the Region. For example, the American Indian and Alaska Native population is clustered in counties with tribal lands in North Dakota and South Dakota. Two or more non-white groups prevail in Chicago metro area.
Asian American group grew rapidly in Midwest in general compared to the rest of the country. In Omaha, Nebraska, this group increased from 17,000 in 2010 to 33,000 in 2020. The Asian American population is highly represented in Minneapolis-St. Paul’s metro area expanded in university and high-technology towns such as Columbus, Ohio, and Madison, Wisconsin.[8]
Figure 4. Most prevalent racial or ethnic groups by county in the North-Central Region in 2020 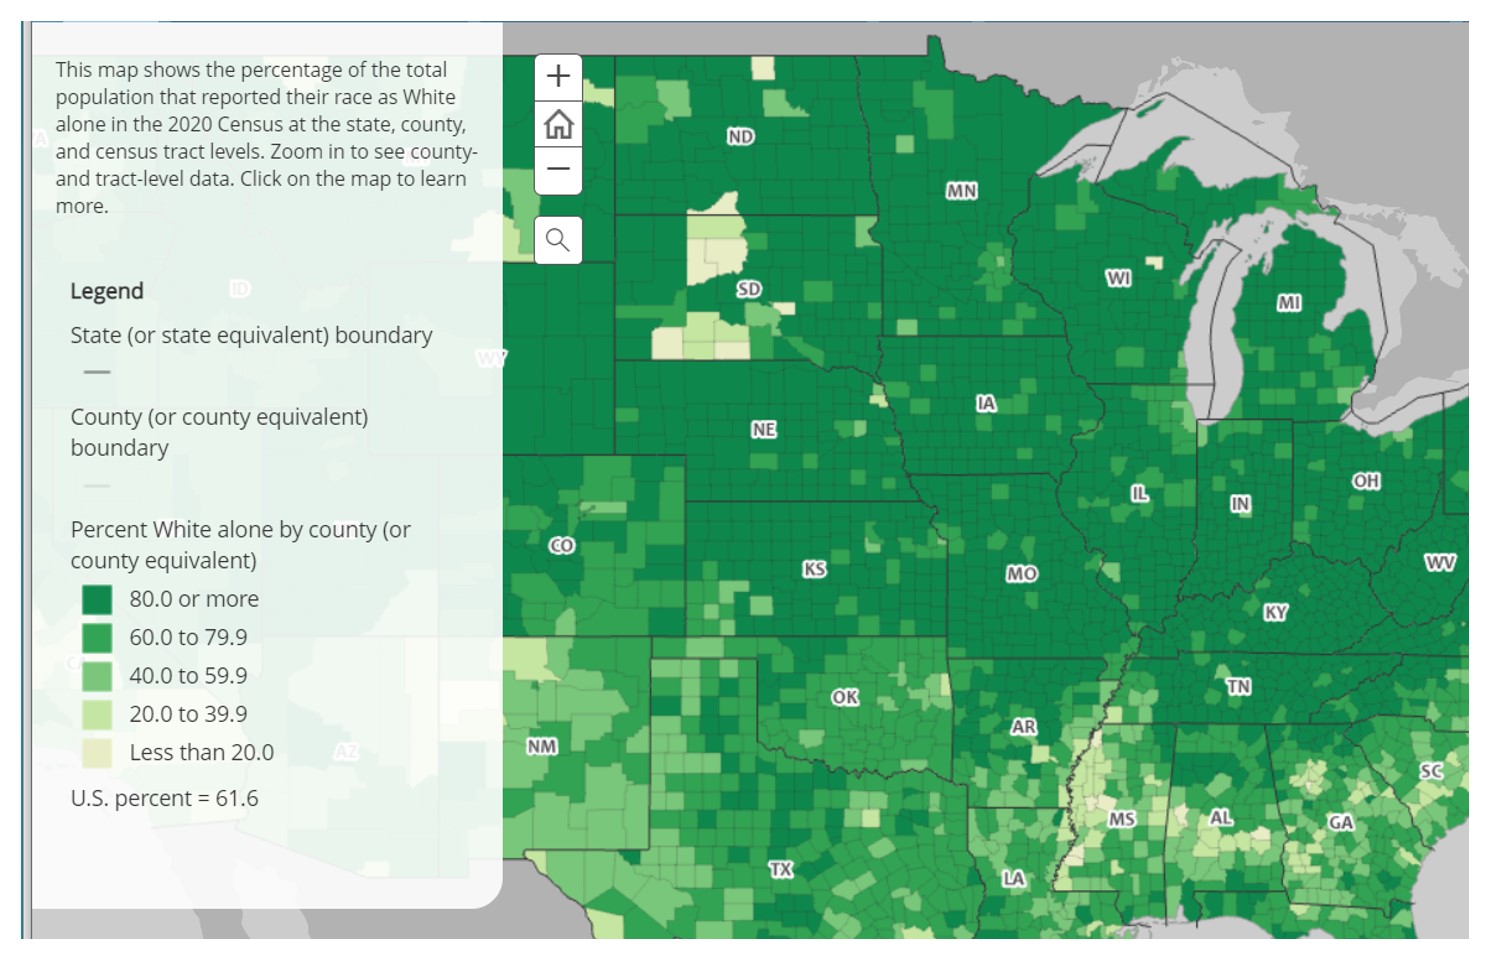 Source: 2020 Census Demographic Data Map Viewer. The U.S. Census Bureau, 2021.
The changes in the racial and ethnic composition of the country, revealed with the new 2020 Census redistricting data, indicate that the rise and geographic spread of different non-White racial or ethnic groups already started demographic changes in the U.S. Moreover, the new data also show that racial and ethnic diversity will continue across the NCR and the country in the decades ahead.
[1] U.S. Census Bureau: https://www.census.gov/library/stories/2021/08/2020-united-states-population-more-racially-ethnically-diverse-than-2010.html
[2] U.S. Census Bureau: https://www.census.gov/newsroom/blogs/random-samplings/2021/08/measuring-racial-ethnic-diversity-2020-census.html
[3] U.S. Census Bureau: https://www.census.gov/library/visualizations/interactive/racial-and-ethnic-diversity-in-the-united-states-2010-and-2020-census.html
[4] Brookings: https://www.brookings.edu/research/mapping-americas-diversity-with-the-2020-census/
[5] Brookings: https://www.brookings.edu/blog/the-avenue/2021/09/28/mapping-rural-americas-diversity-and-demographic-change/
[6] U.S. Census Bureau: https://www.census.gov/library/stories/2021/08/2020-united-states-population-more-racially-ethnically-diverse-than-2010.html
[7] U.S. Census Bureau: https://www.census.gov/library/visualizations/interactive/racial-and-ethnic-diversity-in-the-united-states-2010-and-2020-census.html
[8] Brookings: https://www.brookings.edu/research/mapping-americas-diversity-with-the-2020-census/
——-![]()
Author: Zuzana Bednarikova, zbednari@purdue.edu
Dr. Zuzana Bednarikova is a Research and Extension Specialist at NCRCRD.