Population Change by State and County in North Central Region between 2010 and 2019
According to the U.S. Census Bureau’s state and county population estimates released in December 2019, all states in North Central Region but Illinois (-1.2%) experienced a positive population change between 2010 and 2019 (Figure 1). The positive change ranges from 1% in Michigan and 13.3% in North Dakota. The population grew significantly also in South Dakota (8.7%) and Minnesota (6.3%).
Figure 1. Population Change by State in North Central Region, 2010 – 2019
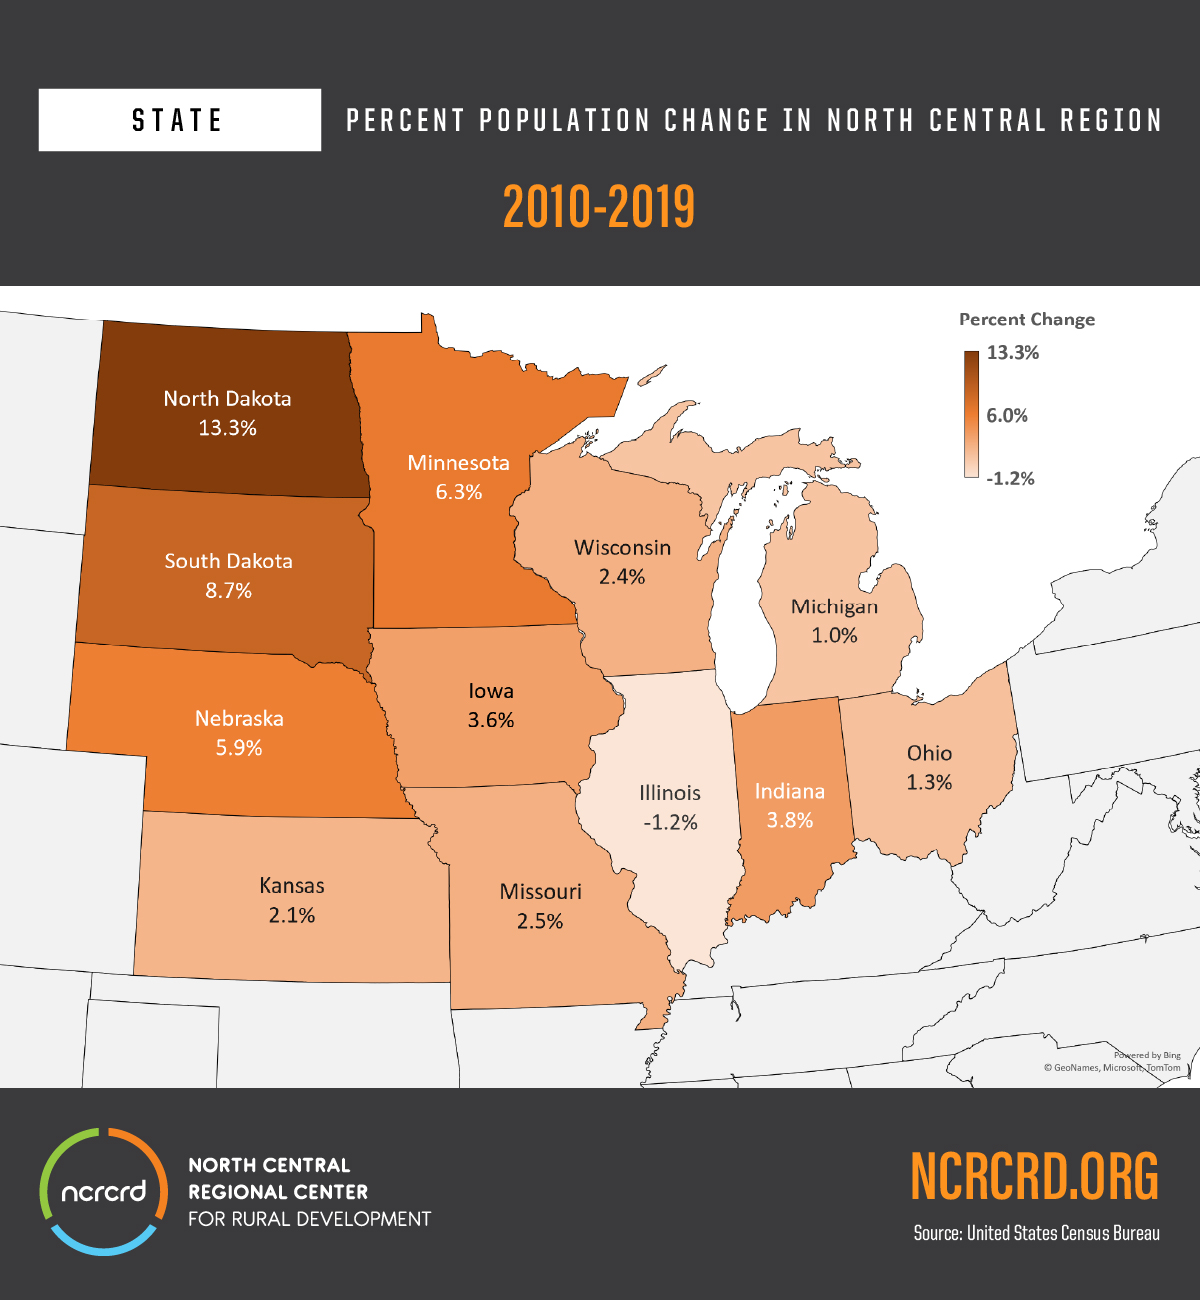
Source: U.S. Census Bureau; Image by Saad Mukhtar
The North Central Region population was at 55.86 million in 2019, up to 2.25% since 2010. Growth had slowed every year since 2014 when the population decreased by 32% relative to the previous year. This decline was mainly driven by negative net domestic migration in the North Central Region largest state Illinois, which offset populations gains from natural increase and net international migration, or the difference between the number of people moving into the state and out of the state. Another reason for the decline is slow population growth in the North Central Region.[1]
All three states with the most growth (North Dakota, South Dakota, and Minnesota) gained their population by natural population growth. Other factors that contributed to the population increase include positive net domestic migration in North Dakota (on average 3,466 people annually) and South Dakota (on average 1,348 people annually), and positive net international migration in Minnesota (on average 11,441 people annually).
Population Growth in North Dakota between 2010 and 2019
North Dakota’s population decreased steadily since it reached a peak of 680,845 in 1930 until 2015. During that period of time, oil exploration and development led to a population increase in 1980, but as the first oil boom faded, the population declined again. The 2010 census showed another increase, also due to the oil and gas development.[2]
North Dakota added an estimated 89,486 residents from 2010 to 2019, making the state the eighth faster-growing state in the U.S. [3] In 2010, North Dakota had a population of 672,591, only a few thousand less than in the 1930 census. In 2019, the population reached a new peak of 762,062. Nevertheless, Figure 2 shows that population growth and decline do not occur evenly across the state.
Figure 2. Population change by county and Municipio: 2010 – 2019
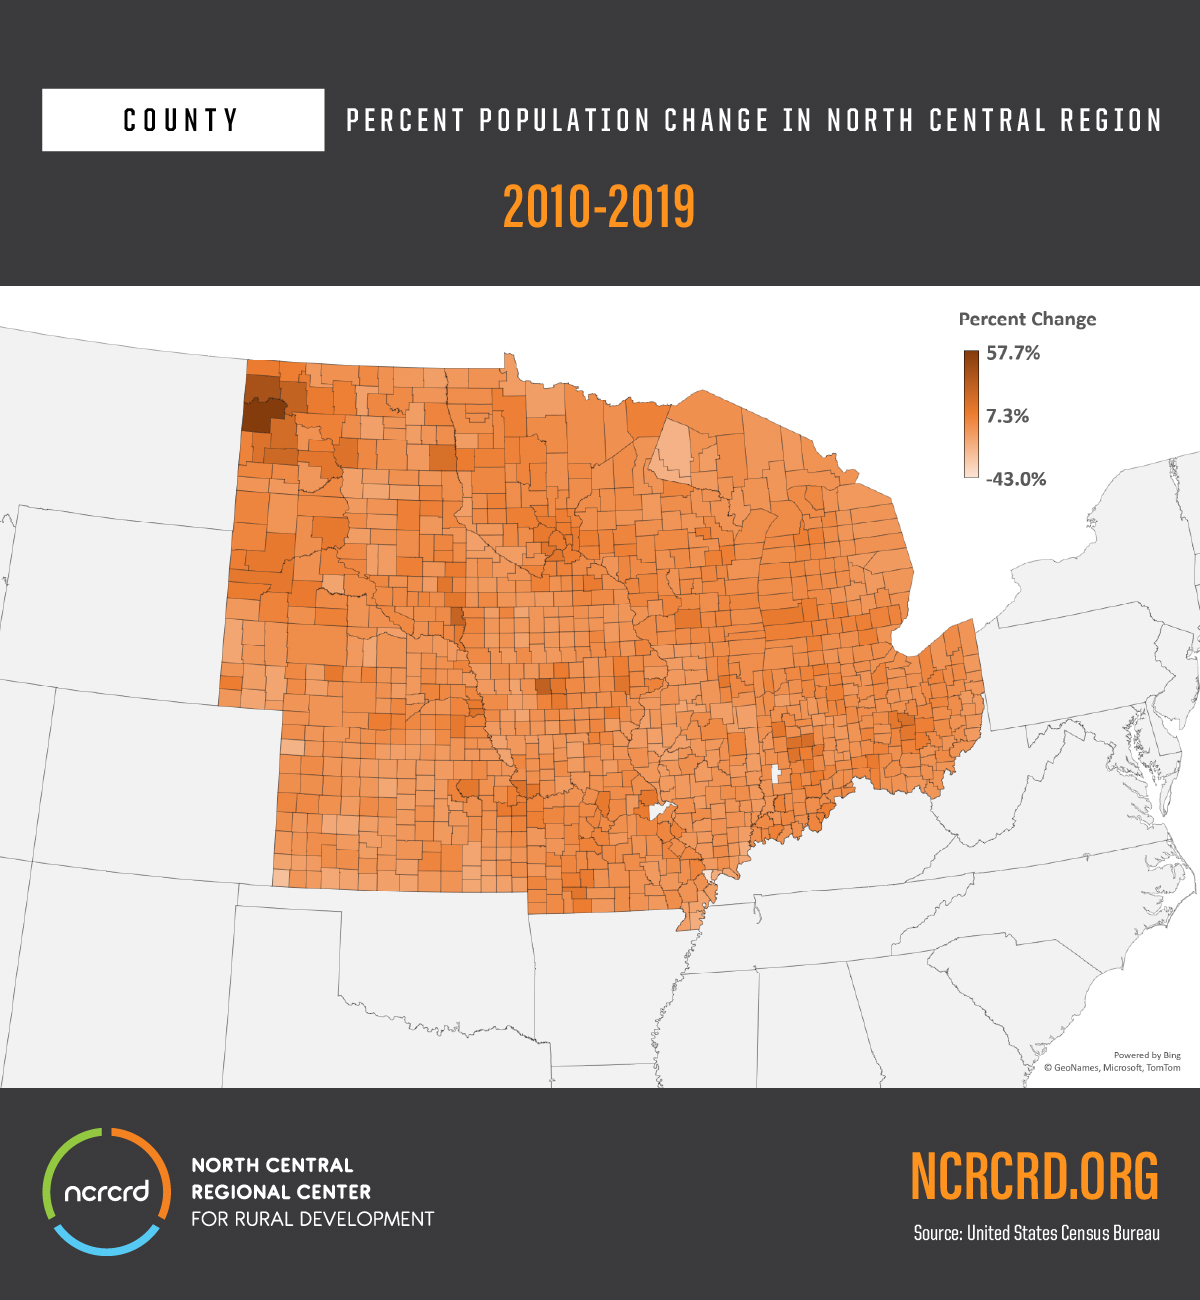
Source: U.S. Census Bureau; Image by Saad Mukhtar
The oil boom in the early 2010s attracted thousands of workers to the western part of the state. Oil workers moved to the oil-rich counties from elsewhere, explaining net domestic migration in the state. But oil is not the only factor in population increase. North Dakota Studies says that the American Indian population is younger – with the median age of 31.3 years old – and significantly contributes to the natural population growth. Finally, almost 20% of the state’s population live in Cass County, and most of these people live in Fargo, the county’s seat. Other counties with major cities, such as Grand Forks, Burleigh, Ward, and Stark counties, also experience population increase.
Population Decline in Illinois between 2010 and 2019
Illinois Policy organization[4] tries to explain why Illinois suffers from the worst population decline since World War II. Illinois recorded six straight years of population loss (from an estimated 12,884,493 in 2014 to an estimated 12,671,821 in 2019), and the seventh year (2020) is expected to be even worse (Figure 3). The main driver of population loss is domestic outmigration. People have been leaving the state for other states to find better housing and employment opportunities and due to poor public policy in Illinois.
Figure 3. Annual change in the Illinois population, 2010 – 2020
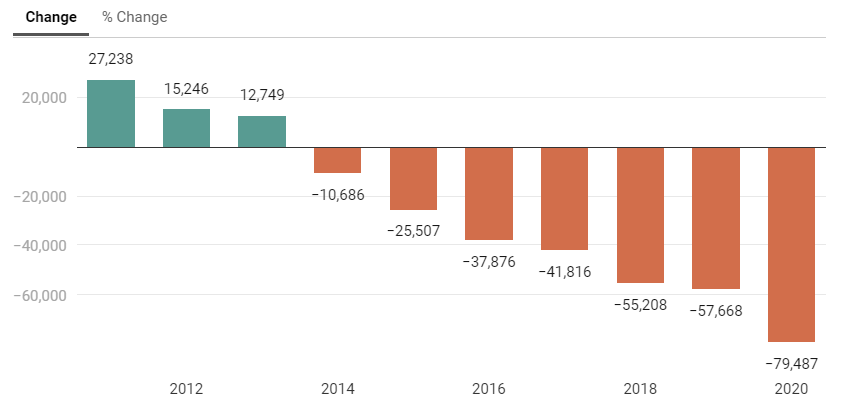
Source: Illinois Policy
Sources:
[1] U.S. Census Bureau, https://www.census.gov/newsroom/press-releases/2019/popest-nation.html
[2] North Dakota Studies – State Historical Society of North Dakota. Accessed on February 3rd, 2020, https://www.ndstudies.gov/gr8/content/unit-iv-modern-north-dakota-1921-present/lesson-1-changing-landscapes/topic-3-ghost-towns-and-railroads/section-3-population-trends-nd
[3] Baumgarten, A. (2020). With a boost from oil, North Dakota’s population growth was among top 10 in 2010s. The Dickinson Press and Forum Communications Company, https://www.thedickinsonpress.com/news/government-and-politics/5034168-With-a-boost-from-oil-North-Dakotas-population-growth-was-among-top-10-in-2010s
[4] Hill, B. 2020. Illinois sees worst population decline since world war. Illinois Policy. Accessed on February 3rd, 2021, https://www.illinoispolicy.org/illinois-sees-worst-population-decline-since-world-war-ii/
——-![]()
Author: Zuzana Bednarikova, zbednari@purdue.edu